<< Chapter < Page Chapter >> Page >

Two intuitively reasonable approaches to developing the equations for the FDM-TDM transmultiplexer are presented in this section. The first emulates [link] . We first develop the equations for a digital counterpart of the analog tuners used in the filter bank and then observe that significant computational improvements can be obtained when the tuning frequencies are linked together in a simple way. The second subsection starts from a different point, that of using the discrete Fourier transform as a spectral channelizer. We ultimately find out that these two approaches yield essentially the same analytical results.

Figure one is a flow chart. From left to right, a title begins the chart. It reads, Baseband Input. An arrow pointing to the right follows. Above the arrow is the description x_c(t). The arrow points at a box containing the label A/D. Below this box is an unlabeled arrow pointing up at the box. To the right of the A/D box is another arrow pointing to the right. Above this arrow is the description x(k). The arrow points at a circle containing a large x. Below this circle is a large arrow pointing up at the circle, with the description e^(-j2πf_0kT) beside it. To the right of the circle is another arrow pointing to the right, and above it is the description ρ(k). The arrow points at a box containing the label Digital Filter h(k). To the right of this box is a bigger arrow pointing to the right. Above this arrow is the label y-bar(k). The arrow points at another box, labeled Decimation M. To the right of this box is a final arrow not pointing at anything, with the description y(r).
Using a digital Tuner to Extract One FDM Channel

The transmux as a bank of single channel digital tuners

Fundamental equations for a single-channel digital tuner

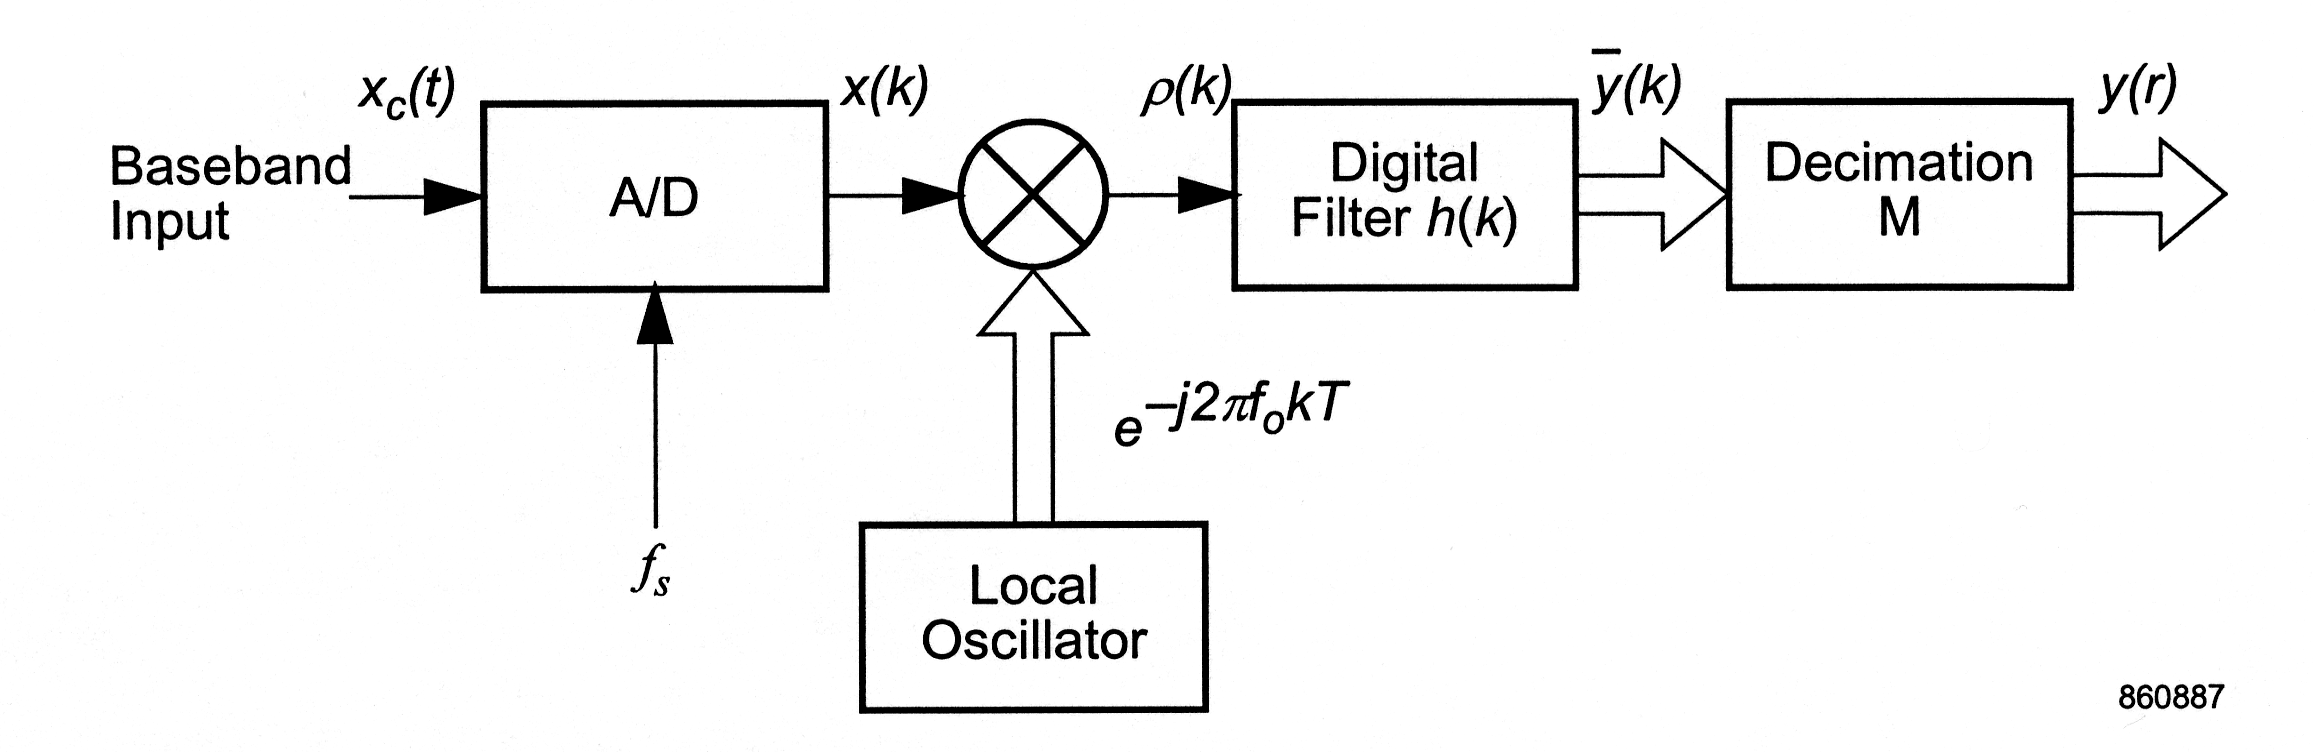
The input FDM signal is assumed to be the continuous-time waveform x c ( t ) . The analog-to-digital converter shown in [link] samples this waveform at the uniform rate of f s samples per second, producing the discrete-time sequence x ( k ) , where x ( k ) x c ( t = k T ) , the integer k is the time index, and T is the sampling interval given by T = 1 f s . The spectrum of this sequence is shifted down in frequency by multiplying it by a complex exponential of the form e - j 2 π f 0 k T , where f 0 is the desired amount of the frequency downconversion. The product of x ( k ) and this exponential is then filtered in discrete time by using the pulse response h ( k ) . The duration of the pulse response h ( k ) is assumed to be finite and in particular of length no greater than L , an integer. The filter output y ¯ ( k ) is then decimated by a factor of M , yielding the sequence y ( r ) , where the integer r is the decimated time index.

These processing steps are shown in graphical form in [link] . Both sides of the two-sided spectrum of the sampled input signal are seen in [link] (a). For the moment, the input signal is assumed to be real-valued and therefore the spectrum is symmetrical around 0 Hz Even though real-valued inputs are assumed here, all of the ensuing analysis applies to complex-valued signals as well. . A channel of interest in this spectrum has been shaded and its center frequency is noted to be f 0 . Multiplying the input signal by e - j 2 π f 0 k T has the effect of shifting the spectrum to the left (assuming 0 f 0 f s 2 ) and centering the desired channel at 0 Hz. The downconverted signal is now complex-valued, and therefore spectral symmetry around 0 Hz is neither required nor expected. The transfer function of the lowpass filter appears in [link] (c). The filter pulse response h ( k ) is chosen to attain the desired spectral characteristics. In particular, the filter needs to pass the channel of interest without degradation and suppress all others sufficiently. How to design such a pulse response is discussed in Appendix A. In general, the quality of the filter grows with the value of the parameter L . The filter shown here is symmetrical around 0 Hz and its pulse response h ( k ) can therefore be real-valued. This is not required however.

After the application of the shifted signal ρ ( k ) to the filter, the spectrum shown in [link] (d) results. The desired channel is isolated from all others. It is sampled, however, at a rate far faster than required by the Nyquist sampling theorem. The filter output is then decimated by the factor M , resulting in the spectrum shown in [link] (e). The channel's bandwidth is the same as before but now its percentage bandwidth, that is, its bandwidth compared to its final sampling rate, is much higher. In a good digital tuner the percentage bandwidth after decimation usually ranges between 0.5 and 0.9, where unity is the theoretical limit imposed by the sampling theorem.

Questions & Answers

what is phylogeny
Odigie Reply
evolutionary history and relationship of an organism or group of organisms
AI-Robot
ok
Deng
what is biology
Hajah Reply
the study of living organisms and their interactions with one another and their environments
AI-Robot
what is biology
Victoria Reply
HOW CAN MAN ORGAN FUNCTION
Alfred Reply
the diagram of the digestive system
Assiatu Reply
allimentary cannel
Ogenrwot
How does twins formed
William Reply
They formed in two ways first when one sperm and one egg are splited by mitosis or two sperm and two eggs join together
Oluwatobi
what is genetics
Josephine Reply
Genetics is the study of heredity
Misack
how does twins formed?
Misack
What is manual
Hassan Reply
discuss biological phenomenon and provide pieces of evidence to show that it was responsible for the formation of eukaryotic organelles
Joseph Reply
what is biology
Yousuf Reply
the study of living organisms and their interactions with one another and their environment.
Wine
discuss the biological phenomenon and provide pieces of evidence to show that it was responsible for the formation of eukaryotic organelles in an essay form
Joseph Reply
what is the blood cells
Shaker Reply
list any five characteristics of the blood cells
Shaker
lack electricity and its more savely than electronic microscope because its naturally by using of light
Abdullahi Reply
advantage of electronic microscope is easily and clearly while disadvantage is dangerous because its electronic. advantage of light microscope is savely and naturally by sun while disadvantage is not easily,means its not sharp and not clear
Abdullahi
cell theory state that every organisms composed of one or more cell,cell is the basic unit of life
Abdullahi
is like gone fail us
DENG
cells is the basic structure and functions of all living things
Ramadan
What is classification
ISCONT Reply
is organisms that are similar into groups called tara
Yamosa
in what situation (s) would be the use of a scanning electron microscope be ideal and why?
Kenna Reply
A scanning electron microscope (SEM) is ideal for situations requiring high-resolution imaging of surfaces. It is commonly used in materials science, biology, and geology to examine the topography and composition of samples at a nanoscale level. SEM is particularly useful for studying fine details,
Hilary
Got questions? Join the online conversation and get instant answers!
Jobilize.com Reply

Get Jobilize Job Search Mobile App in your pocket Now!

Get it on Google Play Download on the App Store Now


Source:  OpenStax, An introduction to the fdm-tdm digital transmultiplexer. OpenStax CNX. Nov 16, 2010 Download for free at http://cnx.org/content/col11165/1.2
Google Play and the Google Play logo are trademarks of Google Inc.

Notification Switch

Would you like to follow the 'An introduction to the fdm-tdm digital transmultiplexer' conversation and receive update notifications?

Ask