

| << Chapter < Page | Chapter >> Page > |
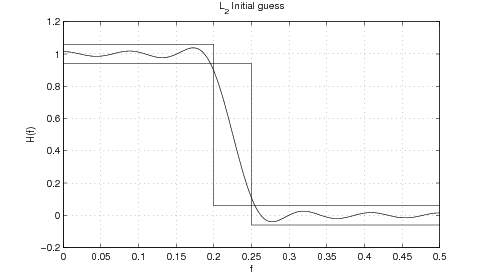
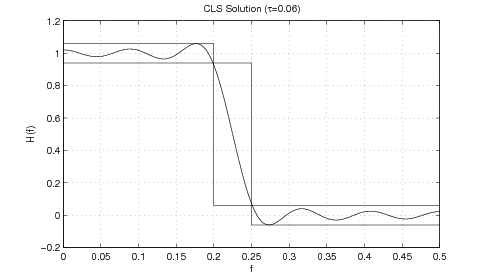
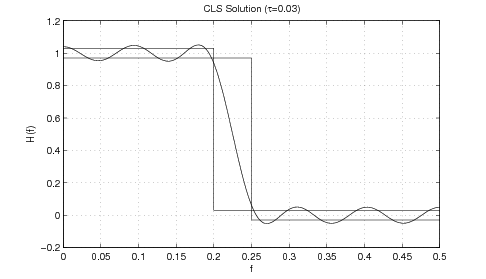
In practice the method outlined above has proven robust particularly in connection with the specified transition band design. Consider the least squares design in [link] (using a length-21 Type-I linear phase low-pass FIR filter with linear transition frequencies ). This example illustrates the typical effect of CLS methods over designs; the largest error (in an sense) can be located at the edges of the transition band. Figures [link] and [link] illustrate design examples using the proposed approach. [link] shows an example of a mild constraint ( ), whereas [link] illustrates an advantage of this method, associated to a hard constraint ( ). The method is trying iteratively to reduce the maximum error towards the constraint; however the specified constraint in [link] is such that even at the point where an equiripple response is reached for the specified transition bands the constraint is not met. At this point the method converges to an optimal solution that approximates equiripple as increases (the examples provided use ).
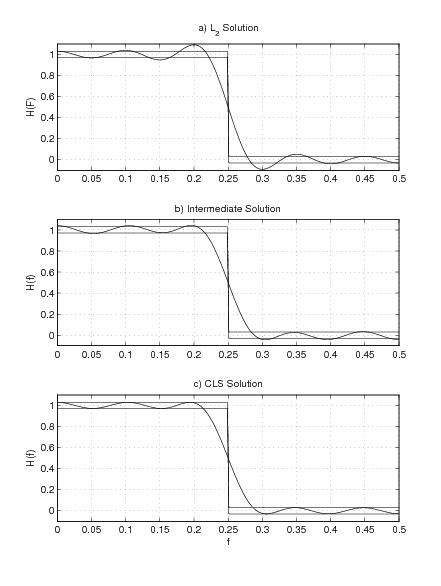
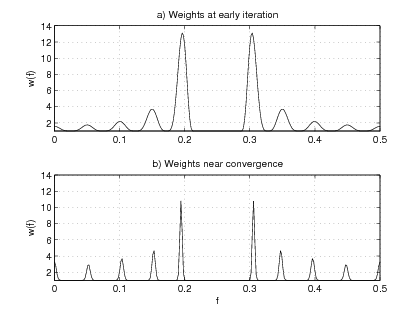
A different behavior occurs when no transition bands are defined. Departing from an initial guess (as shown in [link] .a) the proposed IRLS-based CLS algorithm begins weighting frequencies selectively in order to reduce the error towards the constraints at each iteration. Eventually an equiripple behavior can be observed if the constraints are too harsh (as in [link] .b). The algorithm will keep weighting until all frequencies meet the constraints (as in [link] .c). The absence of a specified transition band presents some ambiguity in defining valid frequencies for weighting. One cannot (or rather should not) apply weights too close to the transition frequency specified as this would result in an effort by the algorithm to create a steep transition region (which as mentioned previously is counterintuitive to finding an equiripple solution). In a sense, this would mean having two opposite effects working at the same time and the algorithm cannot accommodate both, usually leading to numerical problems.
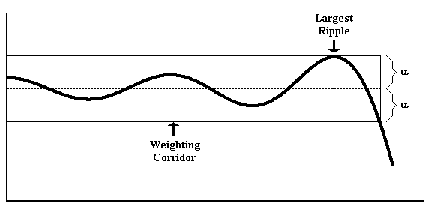
In order to avoid these issues, an algorithm can be devised that selects a subset of the sampled frequencies for weighting purposes at each iteration. The idea is to identify the largest ripple per band at each iteration (the ripple associated with the largest error for a given band) and select the frequencies within that band with errors equal or smaller than such ripple error. In this way one avoids weighting frequencies around the transition frequency. This idea is illustrated in [link] .
The previous example is fundamental since it illustrates the relevance of this method: since for a particular transition band the tightest constraint that one can get is given by the equiripple (or minimax) design (as shown in [link] ), a problem might arise when specifications are tighter than what the minimax design can meet. Adams found this problem (as reported in [link] ); his method breaks under these conditions. The method proposed here overcomes an inadequate constraint and relaxes the transition band to meet the constraint.
Notification Switch
Would you like to follow the 'Iterative design of l_p digital filters' conversation and receive update notifications?

|
|

|
|

|
|

|
|

|
|

|
|

|
|

|
|

|
|

|