<< Chapter < Page Chapter >> Page >

Regions

This thesis sets out to explore the potential impact of harnessing “international collaboration” to the benefit of the participant regions. The emergence of the role of regions within national and international economies has become a field of increasing interest and importance (Karlsson 2007 and Ketels et al. 2008). This chapter explores the concepts of regions and clusters in the context of the facilitating the development of sustainable knowledge driven local economy and in particular the role of government policy in its facilitation.

Knowledge economy - global, european and uk global

As described earlier, the emergence of the knowledge-based economy around the world has been widely acknowledged at an international level, (OECD 1996 and Work Foundation 2006), and also increasingly so at national (DTI 2003 and Shapira et al. 2005) and regional levels. This has led to many countries large and small developing strategies to harness the opportunities of the Knowledge Economy, including nations as diverse as the US, UK (DTI 2004), New Zealand, Malaysia and Scotland (Scot Exec 2001).

Knowledge creation is a key driver of the Knowledge Economy and the United States is the world leader in this regard investing the most into the creation of knowledge; some $285bn annually. This compares with other leading nations as shown in [link] (OECD 2005).

R&D Expenditure by leading nations (OECD 2005).
Country R&D Investment % of OECD expenditure % of National GDP
United States $285bn 42 2.6
EU $211bn 31 2.0
Japan $114bn 17 3.2

Eu and uk

Developing the world’s strongest Knowledge-based economy has become a key goal for the European Union as launched at the Lisbon 2000 Council (Lisbon 2000 EU Council Strategy).

…to become the most dynamic and competitive knowledge based economy in the world

At a European level the disparities in economic performance between regions, even within countries, are highlighted by Figures compiled by the European Commission (EUROSTAT 2004) and shown in [link] . The United Kingdom provides the most striking example of this with Inner London generating GDP per capita at 288% of the EU average while at the other end of UK performance are the Isles of Scilly registering 65% (Wales Objective One region – 73%).

GDP per capita 2001, NUTS 2 level in % of EU-25 average (EU-25 = 100).

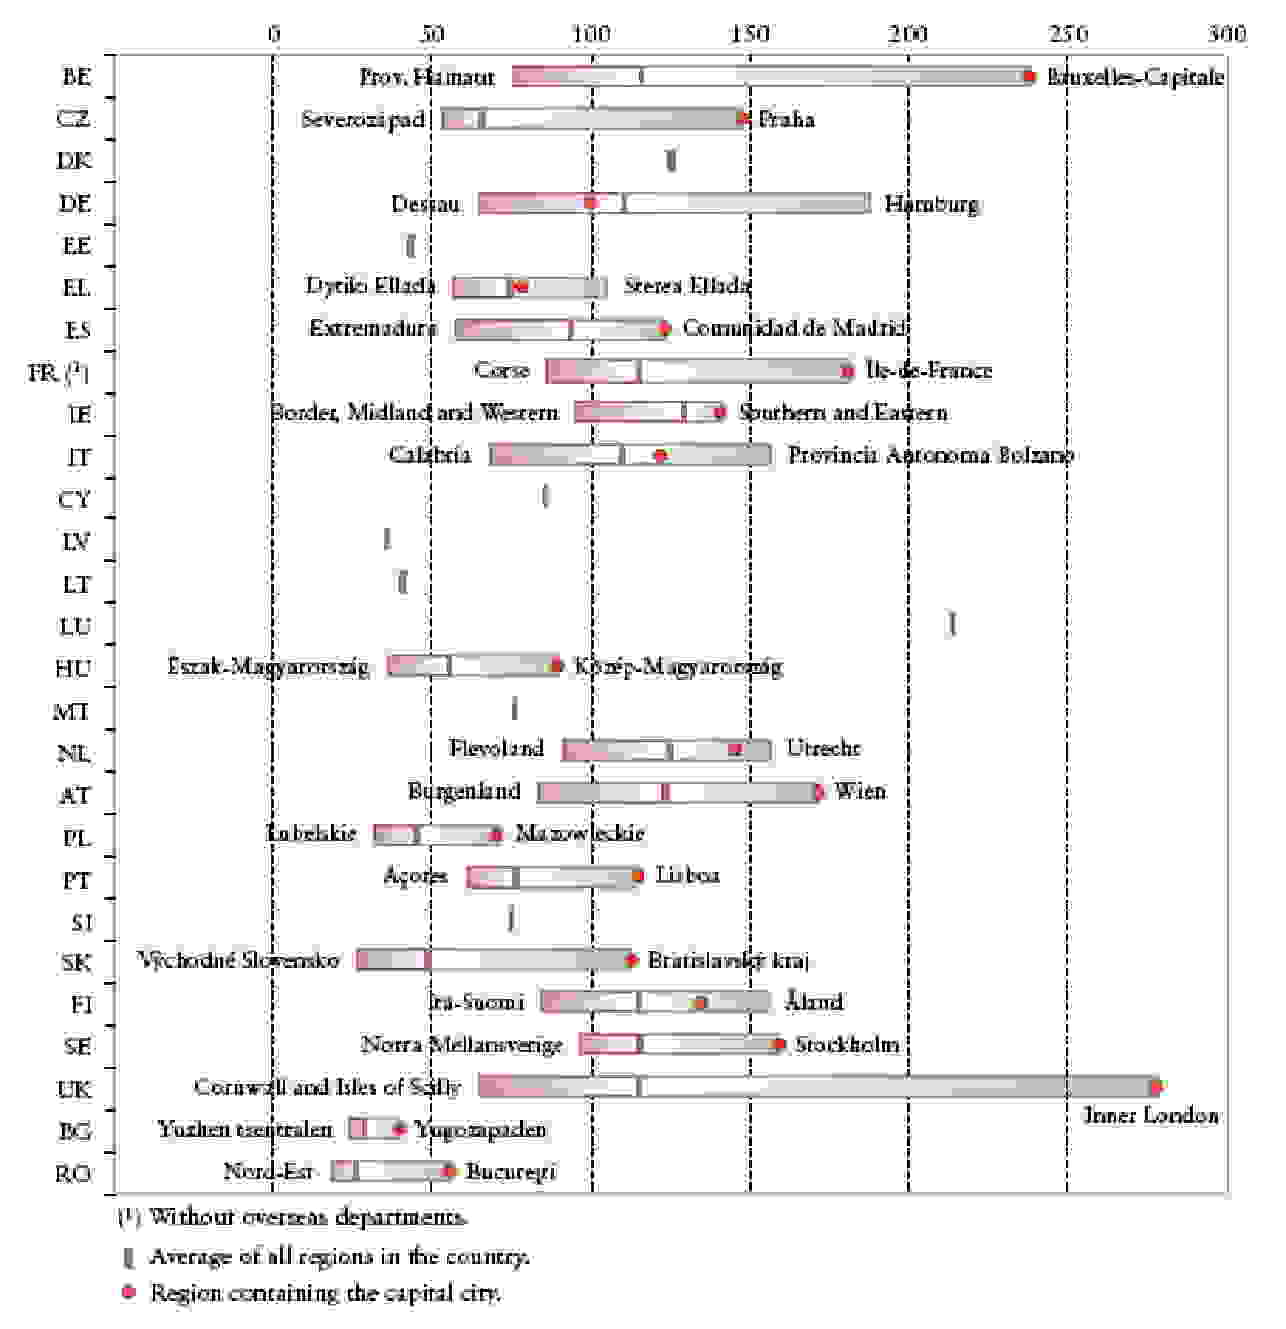
The leading regions are typically those including the capital city and this performance aligns with the intensity of knowledge-based activity as has been shown in Cooke and Clifton (2005). However, this measure serves to highlight one of the limitations of simple GDP measures. As ‘output’ location is recorded rather than ‘income’ region the apparent prosperity of regions can be misleading. For example, relatively few people live in Central London, though a huge amount of GDP is generated. Much of the wealth created in the capital flows out in pay packets to be spent in the commuter-belt. Wales experiences the same phenomenon, with workers flowing into the capital, many from the relatively poor Valleys, to create GDP that registers as an output of Cardiff.

Questions & Answers

differentiate between demand and supply giving examples
Lambiv Reply
differentiated between demand and supply using examples
Lambiv
what is labour ?
Lambiv
how will I do?
Venny Reply
how is the graph works?I don't fully understand
Rezat Reply
information
Eliyee
devaluation
Eliyee
t
WARKISA
hi guys good evening to all
Lambiv
multiple choice question
Aster Reply
appreciation
Eliyee
explain perfect market
Lindiwe Reply
In economics, a perfect market refers to a theoretical construct where all participants have perfect information, goods are homogenous, there are no barriers to entry or exit, and prices are determined solely by supply and demand. It's an idealized model used for analysis,
Ezea
What is ceteris paribus?
Shukri Reply
other things being equal
AI-Robot
When MP₁ becomes negative, TP start to decline. Extuples Suppose that the short-run production function of certain cut-flower firm is given by: Q=4KL-0.6K2 - 0.112 • Where is quantity of cut flower produced, I is labour input and K is fixed capital input (K-5). Determine the average product of lab
Kelo
Extuples Suppose that the short-run production function of certain cut-flower firm is given by: Q=4KL-0.6K2 - 0.112 • Where is quantity of cut flower produced, I is labour input and K is fixed capital input (K-5). Determine the average product of labour (APL) and marginal product of labour (MPL)
Kelo
yes,thank you
Shukri
Can I ask you other question?
Shukri
what is monopoly mean?
Habtamu Reply
What is different between quantity demand and demand?
Shukri Reply
Quantity demanded refers to the specific amount of a good or service that consumers are willing and able to purchase at a give price and within a specific time period. Demand, on the other hand, is a broader concept that encompasses the entire relationship between price and quantity demanded
Ezea
ok
Shukri
how do you save a country economic situation when it's falling apart
Lilia Reply
what is the difference between economic growth and development
Fiker Reply
Economic growth as an increase in the production and consumption of goods and services within an economy.but Economic development as a broader concept that encompasses not only economic growth but also social & human well being.
Shukri
production function means
Jabir
What do you think is more important to focus on when considering inequality ?
Abdisa Reply
any question about economics?
Awais Reply
sir...I just want to ask one question... Define the term contract curve? if you are free please help me to find this answer 🙏
Asui
it is a curve that we get after connecting the pareto optimal combinations of two consumers after their mutually beneficial trade offs
Awais
thank you so much 👍 sir
Asui
In economics, the contract curve refers to the set of points in an Edgeworth box diagram where both parties involved in a trade cannot be made better off without making one of them worse off. It represents the Pareto efficient allocations of goods between two individuals or entities, where neither p
Cornelius
In economics, the contract curve refers to the set of points in an Edgeworth box diagram where both parties involved in a trade cannot be made better off without making one of them worse off. It represents the Pareto efficient allocations of goods between two individuals or entities,
Cornelius
Suppose a consumer consuming two commodities X and Y has The following utility function u=X0.4 Y0.6. If the price of the X and Y are 2 and 3 respectively and income Constraint is birr 50. A,Calculate quantities of x and y which maximize utility. B,Calculate value of Lagrange multiplier. C,Calculate quantities of X and Y consumed with a given price. D,alculate optimum level of output .
Feyisa Reply
Answer
Feyisa
c
Jabir
the market for lemon has 10 potential consumers, each having an individual demand curve p=101-10Qi, where p is price in dollar's per cup and Qi is the number of cups demanded per week by the i th consumer.Find the market demand curve using algebra. Draw an individual demand curve and the market dema
Gsbwnw Reply
suppose the production function is given by ( L, K)=L¼K¾.assuming capital is fixed find APL and MPL. consider the following short run production function:Q=6L²-0.4L³ a) find the value of L that maximizes output b)find the value of L that maximizes marginal product
Abdureman
types of unemployment
Yomi Reply
What is the difference between perfect competition and monopolistic competition?
Mohammed
Got questions? Join the online conversation and get instant answers!
Jobilize.com Reply

Get Jobilize Job Search Mobile App in your pocket Now!

Get it on Google Play Download on the App Store Now


Source:  OpenStax, A study of how a region can lever participation in a global network to accelerate the development of a sustainable technology cluster. OpenStax CNX. Apr 19, 2012 Download for free at http://cnx.org/content/col11417/1.2
Google Play and the Google Play logo are trademarks of Google Inc.

Notification Switch

Would you like to follow the 'A study of how a region can lever participation in a global network to accelerate the development of a sustainable technology cluster' conversation and receive update notifications?

Ask