<< Chapter < Page Chapter >> Page >

where χ = susceptibility, M = variation of magnetization, and H = applied field.

Magnetic permeability

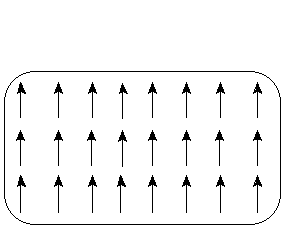
Magnetic permeability is the ability of a material to conduct an electric field. In the same way that materials conduct or resist electricity, materials also conduct or resist a magnetic flux or the flow of magnetic lines of force ( [link] ).

Magnetic ordering in a ferromagnetic material.

Ferromagnetic materials are usually highly permeable to magnetic fields. Just as electrical conductivity is defined as the ratio of the current density to the electric field strength, so the magnetic permeability, μ, of a particular material is defined as the ratio of flux density to magnetic field strength. However unlike in electrical conductivity magnetic permeability is nonlinear.

μ = B/H

Permeability, where μ is written without a subscript, is known as absolute permeability. Instead a variant is used called relative permeability.

μ = μ o x μ r

Absolute permeability is a variation upon 'straight' or absolute permeability, μ, but is more useful as it makes clearer how the presence of a particular material affects the relationship between flux density and field strength. The term 'relative' arises because this permeability is defined in relation to the permeability of a vacuum, μ 0 .

μ r = μ/μ o

For example, if you use a material for which μ r = 3 then you know that the flux density will be three times as great as it would be if we just applied the same field strength to a vacuum.

Initial permeability

Initial permeability describes the relative permeability of a material at low values of B (below 0.1 T). The maximum value for μ in a material is frequently a factor of between 2 and 5 or more above its initial value.

Low flux has the advantage that every ferrite can be measured at that density without risk of saturation. This consistency means that comparison between different ferrites is easy. Also, if you measure the inductance with a normal component bridge then you are doing so with respect to the initial permeability.

Permeability of a vacuum in the si

The permeability of a vacuum has a finite value - about 1.257 × 10 -6 H m -1 - and is denoted by the symbol μ 0 . Note that this value is constant with field strength and temperature. Contrast this with the situation in ferromagnetic materials where μ is strongly dependent upon both. Also, for practical purposes, most non-ferromagnetic substances (such as wood, plastic, glass, bone, copper aluminum, air and water) have permeability almost equal to μ 0 ; that is, their relative permeability is 1.0.

The permeability, μ, the variation of magnetic induction,

with applied field,

μ = B/H

Background contributions

A single measurement of a sample's magnetization is relatively easy to obtain, especially with modern technology. Often it is simply a case of loading the sample into the magnetometer in the correct manner and performing a single measurement. This value is, however, the sum total of the sample, any substrate or backing and the sample mount. A sample substrate can produce a substantial contribution to the sample total.

Questions & Answers

differentiate between demand and supply giving examples
Lambiv Reply
differentiated between demand and supply using examples
Lambiv
what is labour ?
Lambiv
how will I do?
Venny Reply
how is the graph works?I don't fully understand
Rezat Reply
information
Eliyee
devaluation
Eliyee
t
WARKISA
hi guys good evening to all
Lambiv
multiple choice question
Aster Reply
appreciation
Eliyee
explain perfect market
Lindiwe Reply
In economics, a perfect market refers to a theoretical construct where all participants have perfect information, goods are homogenous, there are no barriers to entry or exit, and prices are determined solely by supply and demand. It's an idealized model used for analysis,
Ezea
What is ceteris paribus?
Shukri Reply
other things being equal
AI-Robot
When MP₁ becomes negative, TP start to decline. Extuples Suppose that the short-run production function of certain cut-flower firm is given by: Q=4KL-0.6K2 - 0.112 • Where is quantity of cut flower produced, I is labour input and K is fixed capital input (K-5). Determine the average product of lab
Kelo
Extuples Suppose that the short-run production function of certain cut-flower firm is given by: Q=4KL-0.6K2 - 0.112 • Where is quantity of cut flower produced, I is labour input and K is fixed capital input (K-5). Determine the average product of labour (APL) and marginal product of labour (MPL)
Kelo
yes,thank you
Shukri
Can I ask you other question?
Shukri
what is monopoly mean?
Habtamu Reply
What is different between quantity demand and demand?
Shukri Reply
Quantity demanded refers to the specific amount of a good or service that consumers are willing and able to purchase at a give price and within a specific time period. Demand, on the other hand, is a broader concept that encompasses the entire relationship between price and quantity demanded
Ezea
ok
Shukri
how do you save a country economic situation when it's falling apart
Lilia Reply
what is the difference between economic growth and development
Fiker Reply
Economic growth as an increase in the production and consumption of goods and services within an economy.but Economic development as a broader concept that encompasses not only economic growth but also social & human well being.
Shukri
production function means
Jabir
What do you think is more important to focus on when considering inequality ?
Abdisa Reply
any question about economics?
Awais Reply
sir...I just want to ask one question... Define the term contract curve? if you are free please help me to find this answer 🙏
Asui
it is a curve that we get after connecting the pareto optimal combinations of two consumers after their mutually beneficial trade offs
Awais
thank you so much 👍 sir
Asui
In economics, the contract curve refers to the set of points in an Edgeworth box diagram where both parties involved in a trade cannot be made better off without making one of them worse off. It represents the Pareto efficient allocations of goods between two individuals or entities, where neither p
Cornelius
In economics, the contract curve refers to the set of points in an Edgeworth box diagram where both parties involved in a trade cannot be made better off without making one of them worse off. It represents the Pareto efficient allocations of goods between two individuals or entities,
Cornelius
Suppose a consumer consuming two commodities X and Y has The following utility function u=X0.4 Y0.6. If the price of the X and Y are 2 and 3 respectively and income Constraint is birr 50. A,Calculate quantities of x and y which maximize utility. B,Calculate value of Lagrange multiplier. C,Calculate quantities of X and Y consumed with a given price. D,alculate optimum level of output .
Feyisa Reply
Answer
Feyisa
c
Jabir
the market for lemon has 10 potential consumers, each having an individual demand curve p=101-10Qi, where p is price in dollar's per cup and Qi is the number of cups demanded per week by the i th consumer.Find the market demand curve using algebra. Draw an individual demand curve and the market dema
Gsbwnw Reply
suppose the production function is given by ( L, K)=L¼K¾.assuming capital is fixed find APL and MPL. consider the following short run production function:Q=6L²-0.4L³ a) find the value of L that maximizes output b)find the value of L that maximizes marginal product
Abdureman
types of unemployment
Yomi Reply
What is the difference between perfect competition and monopolistic competition?
Mohammed
Got questions? Join the online conversation and get instant answers!
Jobilize.com Reply

Get Jobilize Job Search Mobile App in your pocket Now!

Get it on Google Play Download on the App Store Now


Source:  OpenStax, Nanomaterials and nanotechnology. OpenStax CNX. May 07, 2014 Download for free at http://legacy.cnx.org/content/col10700/1.13
Google Play and the Google Play logo are trademarks of Google Inc.

Notification Switch

Would you like to follow the 'Nanomaterials and nanotechnology' conversation and receive update notifications?

Ask