

| << Chapter < Page | Chapter >> Page > |
Due to the potential applications of magnetite nanoparticles (Fe 3 O 4 , nMag) many methods have been devised for its synthesis. However, stoichiometric Fe 3 O 4 is not always achieved by different synthetic methods. B-site vacancies introduced into the cubic inverse spinel crystal structure of nMag result in nonstoichiometric iron oxide of the formula (Fe 3+ ) A (Fe (1-3x) 2+ Fe (1+2X) 3+ Ø x ) B O 4 where Ø represents B-site vacancy. The magnetic susceptibility which is key to most nMag applications decreases with increased B-site vacancy hence the extent of B-site vacancy is important. The very high sensitivity of the Mossbauer spectrum to the oxidation state and site occupancy of Fe 3+ in cubic inverse spinel iron oxides makes Mossbauer spectroscopy valuable for addressing the issues of whether or not the product of a synthetic method is actually nMag and the extent of B-site vacancy.
As with most analysis using multiple instrumental methods in conjunction is often helpful. This is exemplified by the use of XRD along with Mossbauer spectroscopy in the following analysis. [link] shows the XRD results and Mossbauer spectra “magnetite” samples prepared by a Fe 2+ /Fe 3+ co-precipitation (Mt025), hematite reduction by hydrogen (MtH2) and hematite reduction with coal(MtC). The XRD analysis shows MtH2 and MT025 exhibiting only magnetite peaks while MtC shows the presence of magnetite, maghemite, and hematite. This information becomes very useful when fitting peaks to the Mossbauer spectra because it gives a chemical basis for peak fitting parameters and helps to fit the peaks correctly.
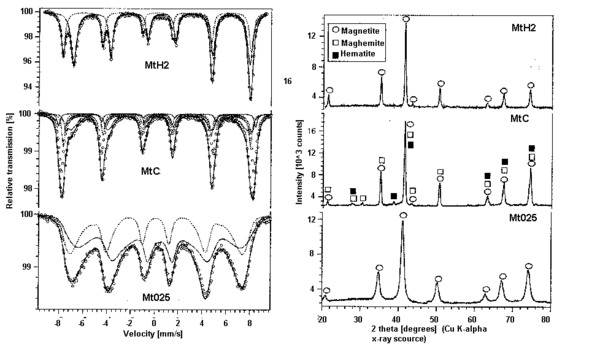
Being that the iron occupies two local environments, the A-site and B site, and two species (Fe 2+ and Fe 3+ ) occupy the B-site one might expect the spectrum to be a combination of 3 spectra, however delocalization of electrons or electron hopping between Fe 2+ and Fe 3+ in the B site causes the nuclei to sense an average valence in the B site thus the spectrum are fitted with two curves accordingly. This is most easily seen in the Mt025 spectrum. The two fitted curves correspond to Fe 3+ in the A-site and mixed valance Fe 2.5+ in the B-site. The isomer shift of the fitted curves can be used to determined which curve corresponds to which valence. The isomer shift relative to the top fitted curve is reported to be 0.661 and the bottom fitted curve is 0.274 relative to αFe thus the top fitted curve corresponds to less s-electron dense Fe 2.5+ . The magnetic splitting is quite apparent. In each of the spectra, six peaks are present due to magnetic splitting of the nuclear energy states as explained previously. Quadrupole splitting is not so apparent, but actually is present in the spectra. The three peaks to the left of the center of a spectrum should be spaced the same as those to the right due to magnetic splitting alone since the energy level spacing between sublevels is equal. This is not the case in the above spectra, because the higher energy I = 3/2 sublevels are split unevenly due to magnetic and quadrupole splitting interactions.
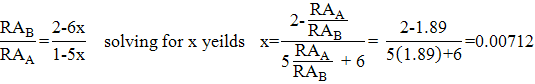
Once the peaks have been fitted appropriately, determination of the extent of B-site vacancy in (Fe 3+ ) A (Fe (1-3x) 2+ Fe (1+2X) 3+ Ø x ) B O 4 is a relatively simple matter. All one has to due to determine the number of vacancies (x) is solve the equation:
![]() where RA
B or A = relative area (
where RA
B or A = relative area (
![]() ) of the curve for the B or A site respectively
) of the curve for the B or A site respectively
The reasoning for this equation is as follows. Taking into account that the mixed valance Fe 2.5+ curve is a result of paired interaction between Fe 2+ and Fe 3+ the nonstochiometric chemical formula is (Fe 3+ ) A (Fe (1-3x) 2+ Fe (1+2X) 3+ Ø x ) B O 4 . The relative intensity (or relative area) of the Fe-A and Fe-B curves is very sensitive to stoichiometry because vacancies in the B-site reduce the Fe-A curve and increase Fe-B curve intensities. This is due to the unpaired Fe 5x 3+ adding to the intensity of the Fe-A curve rather than the Fe-B curve. Since the relative area is directly proportional to the number of Fe contributing to the spectrum the ratio of the relative areas is equal to stoichiometric ratio of Fe 2.5+ to Fe 3+ , which yields the above formula.
Example Calculation:
For MtH2 RA A /RA B = 1.89
Plugging x into the nonstoichiometric iron oxide formula yeilds:
(Fe 3+ ) A (Fe 1.9572 2+ Fe 0.0356 3+ ) B O 4 (very close to stoichiometric)
| Sample | RA B /RA A | X | Chemical formula |
| MtH2 | 1.89 | 0.007 | (Fe 3+ ) A (Fe 0.979 2+ Fe 1.014 3+ ) B O 4 |
| MtC | 1.66 | 0.024 | (Fe 3+ ) A (Fe 0.929 2+ Fe 1.048 3+ ) B O 4 |
| Mt025 | 1.60 | 0.029 | (Fe 3+ ) A (Fe 0.914 2+ Fe 1.057 3+ ) B O 4 |
Notification Switch
Would you like to follow the 'Nanomaterials and nanotechnology' conversation and receive update notifications?

|
|

|
|
|
|
|

|
|

|
|

|
|

|
|

|
|

|
|

|