

| << Chapter < Page | Chapter >> Page > |
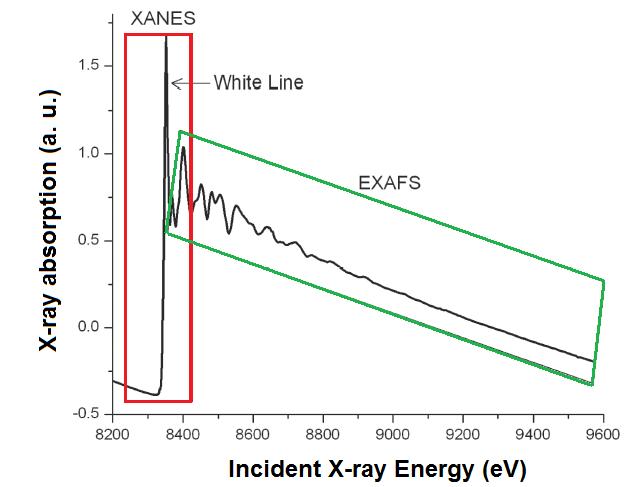
X-ray absorption fine structure (XAFS) spectroscopy includes both X-ray absorption near edge structure (XANES) and extended X-ray absorption fine structure (EXAFS) spectroscopies. The difference between both techniques is the area to analyze, as shown [link] and the information each technique provides. The complete XAFS spectrum is collected across an energy range of around 200 eV before the absorption edge of interest and until 1000 eV after it ( [link] ). The absorption edge is defined as the X-ray energy when the absorption coefficient has a pronounced increasing. This energy is equal to the energy required to excite an electron to an unoccupied orbital.
X-ray absorption near edge structure (XANES) is used to determine the valence state and coordination geometry, whereas extended X-ray absorption fine structure (EXAFS) is used to determine the local molecular structure of a particular element in a sample.
XANES is the part of the absorption spectrum closer an absorption edge. It covers from approximately -50 eV to +200 eV relative to the edge energy ( [link] ). Because the shape of the absorption edge is related to the density of states available for the excitation of the photoelectron, the binding geometry and the oxidation state of the atom affect the XANES part of the absorption spectrum.
Before the absorption edge, there is a linear and smooth area. Then, the edge appears as a step, which can have other extra shapes as isolated peaks, shoulders or a white line , which is a strong peak onto the edge. Those shapes give some information about the atom. For example, the presence of a white line indicates that after the electron releasing, the atomic states of the element is confined by the potential it feels. This peak sharp would be smoothed if the atom could enter to any kind of resonance. Important information is given because of the absorption edge position. Atoms with higher oxidation state have fewer electrons than protons, so, the energy states of the remaining electrons are lowered slightly, which causes a shift of the absorption edge energy up to several eV to a higher X-ray energy.
The EXAFS part of the spectrum is the oscillatory part of the absorption coefficient above around 1000 eV of the absorption edge. This region is used to determine the molecular bonding environments of the elements. EXAFS gives information about the types and numbers of atoms in coordination a specific atom and their inter-atomic distances. The atoms at the same radial distance from a determinate atom form a shell. The number of the atoms in the shell is the coordination number (e.g., [link] ).
Notification Switch
Would you like to follow the 'Nanomaterials and nanotechnology' conversation and receive update notifications?

|
|

|
|

|
|

|
|
|
|
|
|
|
|

|
|
|
|
|

|
|

|