<< Chapter < Page Chapter >> Page >
This module explains how to use Thermal Gravimetric Analysis to obtain information on the properties of SWNTs. It also includes examples on how to interpret the results given by TGA.

Thermogravimetric analysis (TGA) and the associated differential thermal analysis (DTA) are widely used for the characterization of both as-synthesized and side-wall functionalized single walled carbon nanotubes (SWNTs). Under oxygen, SWNTs will pyrolyze leaving any inorganic residue behind. In contrast in an inert atmosphere since most functional groups are labile or decompose upon heating and as SWNTs are stable up to 1200 °C, any weight loss before 800 °C is used to determine the functionalization ratio of side-wall functionalized SWNTs. The following properties of SWNTs can be determined using this TGA;

  1. The mass of metal catalyst impurity in as synthesized SWNTs.
  2. The number of functional groups per SWNT carbon (C SWNT ).
  3. The mass of a reactive species absorbed by a functional group on a SWNT.

Quantitative determination of these properties are used to define the purity of SWNTs, and the extent of their functionalization.

An overview of thermogravimetric analysis

The main function of TGA is the monitoring of the thermal stability of a material by recording the change in mass of the sample with respect to temperature. [link] shows a simple diagram of the inside of a typical TGA.

Schematic representation of a TGA apparatus.

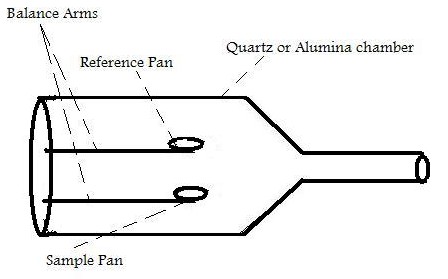
Inside the TGA, there are two pans, a reference pan and a sample pan. The pan material can be either aluminium or platinum. The type of pan used depends on the maximum temperature of a given run. As platinum melts at 1760 °C and alumium melts at 660 °C, platinum pans are chosen when the maximum temperature exceeds 660 °C. Under each pan there is a thermocouple which reads the temperature of the pan. Before the start of each run, each pan is balanced on a balance arm. The balance arms should be calibrated to compensate for the differential thermal expansion between the arms. If the arms are not calibrated, the instrument will only record the temperature at which an event occurred and not the change in mass at a certain time. To calibrate the system, the empty pans are placed on the balance arms and the pans are weighed and zeroed.

As well as recording the change in mass, the heat flow into the sample pan (differential scanning calorimetry, DSC) can also be measured and the difference in temperature between the sample and reference pan (differential thermal analysis, DTA). DSC is quantitative and is a measure of the total energy of the system. This is used to monitor the energy released and absorbed during a chemical reaction for a changing temperature. The DTA shows if and how the sample phase changed. If the DTA is constant, this means that there was no phase change. [link] shows a DTA with typical examples of an exotherm and an endotherm.

Simplified representation of the DTA for an exotherm and an endotherm.

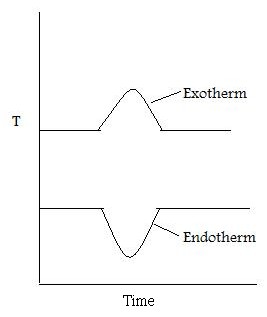
When the sample melts, the DTA dips which signifies an endotherm. When the sample is melting it requires energy from the system. Therefore the temperature of the sample pan decreases compared with the temperature of the reference pan. When the sample has melted, the temperature of the sample pan increases as the sample is releasing energy. Finally the temperatures of the reference and sample pans equilibrate resulting in a constant DTA. When the sample evaporates, there is a peak in the DTA. This exotherm can be explained in the same way as the endotherm.

Questions & Answers

differentiate between demand and supply giving examples
Lambiv Reply
differentiated between demand and supply using examples
Lambiv
what is labour ?
Lambiv
how will I do?
Venny Reply
how is the graph works?I don't fully understand
Rezat Reply
information
Eliyee
devaluation
Eliyee
t
WARKISA
hi guys good evening to all
Lambiv
multiple choice question
Aster Reply
appreciation
Eliyee
explain perfect market
Lindiwe Reply
In economics, a perfect market refers to a theoretical construct where all participants have perfect information, goods are homogenous, there are no barriers to entry or exit, and prices are determined solely by supply and demand. It's an idealized model used for analysis,
Ezea
What is ceteris paribus?
Shukri Reply
other things being equal
AI-Robot
When MP₁ becomes negative, TP start to decline. Extuples Suppose that the short-run production function of certain cut-flower firm is given by: Q=4KL-0.6K2 - 0.112 • Where is quantity of cut flower produced, I is labour input and K is fixed capital input (K-5). Determine the average product of lab
Kelo
Extuples Suppose that the short-run production function of certain cut-flower firm is given by: Q=4KL-0.6K2 - 0.112 • Where is quantity of cut flower produced, I is labour input and K is fixed capital input (K-5). Determine the average product of labour (APL) and marginal product of labour (MPL)
Kelo
yes,thank you
Shukri
Can I ask you other question?
Shukri
what is monopoly mean?
Habtamu Reply
What is different between quantity demand and demand?
Shukri Reply
Quantity demanded refers to the specific amount of a good or service that consumers are willing and able to purchase at a give price and within a specific time period. Demand, on the other hand, is a broader concept that encompasses the entire relationship between price and quantity demanded
Ezea
ok
Shukri
how do you save a country economic situation when it's falling apart
Lilia Reply
what is the difference between economic growth and development
Fiker Reply
Economic growth as an increase in the production and consumption of goods and services within an economy.but Economic development as a broader concept that encompasses not only economic growth but also social & human well being.
Shukri
production function means
Jabir
What do you think is more important to focus on when considering inequality ?
Abdisa Reply
any question about economics?
Awais Reply
sir...I just want to ask one question... Define the term contract curve? if you are free please help me to find this answer 🙏
Asui
it is a curve that we get after connecting the pareto optimal combinations of two consumers after their mutually beneficial trade offs
Awais
thank you so much 👍 sir
Asui
In economics, the contract curve refers to the set of points in an Edgeworth box diagram where both parties involved in a trade cannot be made better off without making one of them worse off. It represents the Pareto efficient allocations of goods between two individuals or entities, where neither p
Cornelius
In economics, the contract curve refers to the set of points in an Edgeworth box diagram where both parties involved in a trade cannot be made better off without making one of them worse off. It represents the Pareto efficient allocations of goods between two individuals or entities,
Cornelius
Suppose a consumer consuming two commodities X and Y has The following utility function u=X0.4 Y0.6. If the price of the X and Y are 2 and 3 respectively and income Constraint is birr 50. A,Calculate quantities of x and y which maximize utility. B,Calculate value of Lagrange multiplier. C,Calculate quantities of X and Y consumed with a given price. D,alculate optimum level of output .
Feyisa Reply
Answer
Feyisa
c
Jabir
the market for lemon has 10 potential consumers, each having an individual demand curve p=101-10Qi, where p is price in dollar's per cup and Qi is the number of cups demanded per week by the i th consumer.Find the market demand curve using algebra. Draw an individual demand curve and the market dema
Gsbwnw Reply
suppose the production function is given by ( L, K)=L¼K¾.assuming capital is fixed find APL and MPL. consider the following short run production function:Q=6L²-0.4L³ a) find the value of L that maximizes output b)find the value of L that maximizes marginal product
Abdureman
types of unemployment
Yomi Reply
What is the difference between perfect competition and monopolistic competition?
Mohammed
Got questions? Join the online conversation and get instant answers!
Jobilize.com Reply

Get Jobilize Job Search Mobile App in your pocket Now!

Get it on Google Play Download on the App Store Now


Source:  OpenStax, Nanomaterials and nanotechnology. OpenStax CNX. May 07, 2014 Download for free at http://legacy.cnx.org/content/col10700/1.13
Google Play and the Google Play logo are trademarks of Google Inc.

Notification Switch

Would you like to follow the 'Nanomaterials and nanotechnology' conversation and receive update notifications?

Ask