<< Chapter < Page Chapter >> Page >

Pollution as a negative externality

Pollution is a negative externality. Economists illustrate the social costs    of production with a demand and supply diagram. The social costs include the private costs of production incurred by the company and the external costs of pollution that are passed on to society. [link] shows the demand and supply for manufacturing refrigerators. The demand curve (D) shows the quantity demanded at each price. The supply curve (S private ) shows the quantity of refrigerators supplied by all the firms at each price if they are taking only their private costs into account and they are allowed to emit pollution at zero cost. The market equilibrium (E 0 ), where quantity supplied and quantity demanded are equal, is at a price of $650 and a quantity of 45,000. This information is also reflected in the first three columns of [link] .
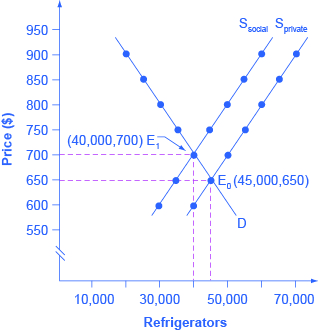
Taking social costs into account: a supply shift

The graph shows how equilibrium changes based on whether a firm focuses on its own costs or social costs.
If the firm takes only its own costs of production into account, then its supply curve will be S private , and the market equilibrium will occur at E 0 . Accounting for additional external costs of $100 for every unit produced, the firm’s supply curve will be S social . The new equilibrium will occur at E 1 .
A supply shift caused by pollution costs
Price Quantity Demanded Quantity Supplied before Considering Pollution Cost Quantity Supplied after Considering Pollution Cost
$600 50,000 40,000 30,000
$650 45,000 45,000 35,000
$700 40,000 50,000 40,000
$750 35,000 55,000 45,000
$800 30,000 60,000 50,000
$850 25,000 65,000 55,000
$900 20,000 70,000 60,000

However, as a by-product of the metals, plastics, chemicals and energy that are used in manufacturing refrigerators, some pollution is created. Let’s say that, if these pollutants were emitted into the air and water, they would create costs of $100 per refrigerator produced. These costs might occur because of injuries to human health, property values, wildlife habitat, reduction of recreation possibilities, or because of other negative impacts. In a market with no anti-pollution restrictions, firms can dispose of certain wastes absolutely free. Now imagine that firms which produce refrigerators must factor in these external costs of pollution—that is, the firms have to consider not only the costs of labor and materials needed to make a refrigerator, but also the broader costs to society of injuries to health and other values caused by pollution. If the firm is required to pay $100 for the additional external costs of pollution each time it produces a refrigerator, production becomes more costly and the entire supply curve shifts up by $100.

As illustrated in the fourth column of [link] and in [link] , the firm will need to receive a price of $700 per refrigerator and produce a quantity of 40,000—and the firm’s new supply curve will be S social . The new equilibrium will occur at E 1 , taking the additional external costs of pollution into account results in a higher price, a lower quantity of production, and a lower quantity of pollution. The following Work It Out feature will walk you through an example, this time with musical accompaniment.

Questions & Answers

differentiate between demand and supply giving examples
Lambiv Reply
differentiated between demand and supply using examples
Lambiv
what is labour ?
Lambiv
how will I do?
Venny Reply
how is the graph works?I don't fully understand
Rezat Reply
information
Eliyee
devaluation
Eliyee
t
WARKISA
hi guys good evening to all
Lambiv
multiple choice question
Aster Reply
appreciation
Eliyee
explain perfect market
Lindiwe Reply
In economics, a perfect market refers to a theoretical construct where all participants have perfect information, goods are homogenous, there are no barriers to entry or exit, and prices are determined solely by supply and demand. It's an idealized model used for analysis,
Ezea
What is ceteris paribus?
Shukri Reply
other things being equal
AI-Robot
When MP₁ becomes negative, TP start to decline. Extuples Suppose that the short-run production function of certain cut-flower firm is given by: Q=4KL-0.6K2 - 0.112 • Where is quantity of cut flower produced, I is labour input and K is fixed capital input (K-5). Determine the average product of lab
Kelo
Extuples Suppose that the short-run production function of certain cut-flower firm is given by: Q=4KL-0.6K2 - 0.112 • Where is quantity of cut flower produced, I is labour input and K is fixed capital input (K-5). Determine the average product of labour (APL) and marginal product of labour (MPL)
Kelo
yes,thank you
Shukri
Can I ask you other question?
Shukri
what is monopoly mean?
Habtamu Reply
What is different between quantity demand and demand?
Shukri Reply
Quantity demanded refers to the specific amount of a good or service that consumers are willing and able to purchase at a give price and within a specific time period. Demand, on the other hand, is a broader concept that encompasses the entire relationship between price and quantity demanded
Ezea
ok
Shukri
how do you save a country economic situation when it's falling apart
Lilia Reply
what is the difference between economic growth and development
Fiker Reply
Economic growth as an increase in the production and consumption of goods and services within an economy.but Economic development as a broader concept that encompasses not only economic growth but also social & human well being.
Shukri
production function means
Jabir
What do you think is more important to focus on when considering inequality ?
Abdisa Reply
any question about economics?
Awais Reply
sir...I just want to ask one question... Define the term contract curve? if you are free please help me to find this answer 🙏
Asui
it is a curve that we get after connecting the pareto optimal combinations of two consumers after their mutually beneficial trade offs
Awais
thank you so much 👍 sir
Asui
In economics, the contract curve refers to the set of points in an Edgeworth box diagram where both parties involved in a trade cannot be made better off without making one of them worse off. It represents the Pareto efficient allocations of goods between two individuals or entities, where neither p
Cornelius
In economics, the contract curve refers to the set of points in an Edgeworth box diagram where both parties involved in a trade cannot be made better off without making one of them worse off. It represents the Pareto efficient allocations of goods between two individuals or entities,
Cornelius
Suppose a consumer consuming two commodities X and Y has The following utility function u=X0.4 Y0.6. If the price of the X and Y are 2 and 3 respectively and income Constraint is birr 50. A,Calculate quantities of x and y which maximize utility. B,Calculate value of Lagrange multiplier. C,Calculate quantities of X and Y consumed with a given price. D,alculate optimum level of output .
Feyisa Reply
Answer
Feyisa
c
Jabir
the market for lemon has 10 potential consumers, each having an individual demand curve p=101-10Qi, where p is price in dollar's per cup and Qi is the number of cups demanded per week by the i th consumer.Find the market demand curve using algebra. Draw an individual demand curve and the market dema
Gsbwnw Reply
suppose the production function is given by ( L, K)=L¼K¾.assuming capital is fixed find APL and MPL. consider the following short run production function:Q=6L²-0.4L³ a) find the value of L that maximizes output b)find the value of L that maximizes marginal product
Abdureman
types of unemployment
Yomi Reply
What is the difference between perfect competition and monopolistic competition?
Mohammed
Got questions? Join the online conversation and get instant answers!
Jobilize.com Reply

Get Jobilize Job Search Mobile App in your pocket Now!

Get it on Google Play Download on the App Store Now


Source:  OpenStax, Microeconomics. OpenStax CNX. Aug 03, 2014 Download for free at http://legacy.cnx.org/content/col11627/1.10
Google Play and the Google Play logo are trademarks of Google Inc.

Notification Switch

Would you like to follow the 'Microeconomics' conversation and receive update notifications?

Ask