

| << Chapter < Page | Chapter >> Page > |
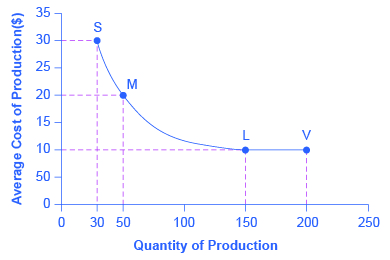
In this example, a small or medium plant, like S or M, will not be able to compete in the market with a large or a very large plant like L or V, because the firm that operates L or V will be able to produce and sell their output at a lower price. In this example, economies of scale operate up to point L, but beyond point L to V, the additional scale of production does not continue to reduce average costs of production.
The concept of economies of scale becomes especially relevant to international trade when it enables one or two large producers to supply the entire country. For example, a single large automobile factory could probably supply all the cars purchased in a smaller economy like the United Kingdom or Belgium in a given year. However, if a country has only one or two large factories producing cars, and no international trade , then consumers in that country would have relatively little choice between kinds of cars (other than the color of the paint and other nonessential options). Little or no competition will exist between different car manufacturers.
International trade provides a way to combine the lower average production costs that come from economies of scale and still have competition and variety for consumers. Large automobile factories in different countries can make and sell their products around the world. If the U.S. automobile market was made up of only General Motors, Ford, and Chrysler, the level of competition and consumer choice would be quite a lot lower than when U.S. carmakers must face competition from Toyota, Honda, Suzuki, Fiat, Mitsubishi, Nissan, Volkswagen, Kia, Hyundai, BMW, Subaru, and others. Greater competition brings with it innovation and responsiveness to what consumers want. America’s car producers make far better cars now than they did several decades ago, and much of the reason is competitive pressure, especially from East Asian and European carmakers.
The sources of gains from intra-industry trade between similar economies—namely, the learning that comes from a high degree of specialization and splitting up the value chain and from economies of scale—do not contradict the earlier theory of comparative advantage. Instead, they help to broaden the concept.
In intra-industry trade, the level of worker productivity is not determined by climate or geography. It is not even determined by the general level of education or skill. Instead, the level of worker productivity is determined by how firms engage in specific learning about specialized products, including taking advantage of economies of scale. In this vision, comparative advantage can be dynamic—that is, it can evolve and change over time as new skills are developed and as the value chain is split up in new ways. This line of thinking also suggests that countries are not destined to have the same comparative advantage forever, but must instead be flexible in response to ongoing changes in comparative advantage.
A large share of global trade happens between high-income economies that are quite similar in having well-educated workers and advanced technology. These countries practice intra-industry trade, in which they import and export the same products at the same time, like cars, machinery, and computers. In the case of intra-industry trade between economies with similar income levels, the gains from trade come from specialized learning in very particular tasks and from economies of scale. Splitting up the value chain means that several stages of producing a good take place in different countries around the world.
From earlier chapters you will recall that technological change shifts the average cost curves. Draw a graph showing how technological change could influence intra-industry trade.
Consider two countries: South Korea and Taiwan. Taiwan can produce one million mobile phones per day at the cost of $10 per phone and South Korea can produce 50 million mobile phones at $5 per phone. Assume these phones are the same type and quality and there is only one price. What is the minimum price at which both countries will engage in trade?
U.S. Census Bureau. 2015. “U.S. International Trade in Goods and Services: December 2014.” Accessed April 13, 2015. http://www.bea.gov/newsreleases/international/trade/2015/pdf/trad1214.pdf.
U.S. Census Bureau. U.S. Bureau of Economic Analysis. 2015. “U.S. International Trade in Goods and Services February 2015.” Accessed April 10, 2015. https://www.census.gov/foreign-trade/Press-Release/current_press_release/ft900.pdf.
Vernengo, Matias. “What Do Undergraduates Really Need to Know About Trade and Finance?” in Political Economy and Contemporary Capitalism: Radical Perspectives on Economic Theory and Policy , ed. Ron Baiman, Heather Boushey, and Dawn Saunders. M. E. Sharpe Inc, 2000. Armonk. 177-183.
Notification Switch
Would you like to follow the 'Microeconomics' conversation and receive update notifications?

|
|
|
|
|

|
|

|
|

|
|

|
|

|
|

|
|

|
|
|
|
|

|
|

|