<< Chapter < Page Chapter >> Page >
By the end of this section, you will be able to:
  • Calculate profits by comparing total revenue and total cost
  • Identify profits and losses with the average cost curve
  • Explain the shutdown point
  • Determine the price at which a firm should continue producing in the short run

A perfectly competitive firm has only one major decision to make—namely, what quantity to produce. To understand why this is so, consider a different way of writing out the basic definition of profit :

Profit = Total revenue Total cost           = ( Price ) ( Quantity produced ) ( Average cost ) ( Quantity produced )

Since a perfectly competitive firm must accept the price for its output as determined by the product’s market demand and supply, it cannot choose the price it charges. This is already determined in the profit equation, and so the perfectly competitive firm can sell any number of units at exactly the same price. It implies that the firm faces a perfectly elastic demand curve for its product: buyers are willing to buy any number of units of output from the firm at the market price. When the perfectly competitive firm chooses what quantity to produce, then this quantity—along with the prices prevailing in the market for output and inputs—will determine the firm’s total revenue, total costs, and ultimately, level of profits.

Determining the highest profit by comparing total revenue and total cost

A perfectly competitive firm can sell as large a quantity as it wishes, as long as it accepts the prevailing market price. Total revenue is going to increase as the firm sells more, depending on the price of the product and the number of units sold. If you increase the number of units sold at a given price, then total revenue will increase. If the price of the product increases for every unit sold, then total revenue also increases. As an example of how a perfectly competitive firm decides what quantity to produce, consider the case of a small farmer who produces raspberries and sells them frozen for $4 per pack. Sales of one pack of raspberries will bring in $4, two packs will be $8, three packs will be $12, and so on. If, for example, the price of frozen raspberries doubles to $8 per pack, then sales of one pack of raspberries will be $8, two packs will be $16, three packs will be $24, and so on.

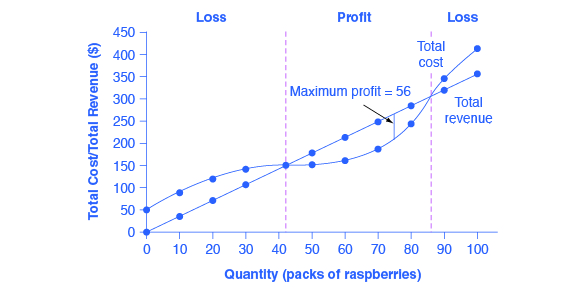
Total revenue and total costs for the raspberry farm, broken down into fixed and variable costs, are shown in [link] and also appear in [link] . The horizontal axis shows the quantity of frozen raspberries produced in packs; the vertical axis shows both total revenue and total costs, measured in dollars. The total cost curve intersects with the vertical axis at a value that shows the level of fixed costs, and then slopes upward. All these cost curves follow the same characteristics as the curves covered in the Cost and Industry Structure chapter.

Total cost and total revenue at the raspberry farm

The graph shows that firms will incur a loss if the total cost is higher than the total revenue.
Total revenue for a perfectly competitive firm is a straight line sloping up. The slope is equal to the price of the good. Total cost also slopes up, but with some curvature. At higher levels of output, total cost begins to slope upward more steeply because of diminishing marginal returns. The maximum profit will occur at the quantity where the gap of total revenue over total cost is largest.

Questions & Answers

Ayele, K., 2003. Introductory Economics, 3rd ed., Addis Ababa.
Widad Reply
can you send the book attached ?
Ariel
?
Ariel
What is economics
Widad Reply
the study of how humans make choices under conditions of scarcity
AI-Robot
U(x,y) = (x×y)1/2 find mu of x for y
Desalegn Reply
U(x,y) = (x×y)1/2 find mu of x for y
Desalegn
what is ecnomics
Jan Reply
this is the study of how the society manages it's scarce resources
Belonwu
what is macroeconomic
John Reply
macroeconomic is the branch of economics which studies actions, scale, activities and behaviour of the aggregate economy as a whole.
husaini
etc
husaini
difference between firm and industry
husaini Reply
what's the difference between a firm and an industry
Abdul
firm is the unit which transform inputs to output where as industry contain combination of firms with similar production 😅😅
Abdulraufu
Suppose the demand function that a firm faces shifted from Qd  120 3P to Qd  90  3P and the supply function has shifted from QS  20  2P to QS 10  2P . a) Find the effect of this change on price and quantity. b) Which of the changes in demand and supply is higher?
Toofiq Reply
explain standard reason why economic is a science
innocent Reply
factors influencing supply
Petrus Reply
what is economic.
Milan Reply
scares means__________________ends resources. unlimited
Jan
economics is a science that studies human behaviour as a relationship b/w ends and scares means which have alternative uses
Jan
calculate the profit maximizing for demand and supply
Zarshad Reply
Why qualify 28 supplies
Milan
what are explicit costs
Nomsa Reply
out-of-pocket costs for a firm, for example, payments for wages and salaries, rent, or materials
AI-Robot
concepts of supply in microeconomics
David Reply
economic overview notes
Amahle Reply
identify a demand and a supply curve
Salome Reply
i don't know
Parul
there's a difference
Aryan
Demand curve shows that how supply and others conditions affect on demand of a particular thing and what percent demand increase whith increase of supply of goods
Israr
Hi Sir please how do u calculate Cross elastic demand and income elastic demand?
Abari

Get Jobilize Job Search Mobile App in your pocket Now!

Get it on Google Play Download on the App Store Now


Source:  OpenStax, Microeconomics. OpenStax CNX. Aug 03, 2014 Download for free at http://legacy.cnx.org/content/col11627/1.10
Google Play and the Google Play logo are trademarks of Google Inc.

Notification Switch

Would you like to follow the 'Microeconomics' conversation and receive update notifications?

Ask