<< Chapter < Page Chapter >> Page >

When the United States eliminates trade barriers in one area, consumers spend the money they save on that product elsewhere in the economy—so there is no overall loss of jobs for the economy as a whole. Of course, workers in some of the poorest countries of the world who would otherwise have jobs producing textiles, would gain considerably if the United States reduced its barriers to trade in textiles. That said, there are good reasons to be wary about reducing barriers to trade. The 2012 and 2013 Bangladeshi fires in textile factories, which resulted in a horrific loss of life, present complications that our simplified analysis in the chapter will not capture.

Realizing the compromises between nations that come about due to trade policy, many countries came together in 1947 to form the General Agreement on Tariffs and Trade (GATT). (We’ll cover the GATT in more detail later in the chapter.) This agreement has since been superseded by the World Trade Organization (WTO)    , whose membership includes about 150 nations and most of the economies of the world. It is the primary international mechanism through which nations negotiate their trade rules—including rules about tariffs, quotas, and nontariff barriers. The next section examines the results of such protectionism and develops a simple model to show the impact of trade policy.

Demand and supply analysis of protectionism

To the non-economist, restricting imports may appear to be nothing more than taking sales from foreign producers and giving them to domestic producers. Other factors are at work, however, because firms do not operate in a vacuum. Instead, firms sell their products either to consumers or to other firms (if they are business suppliers), who are also affected by the trade barriers. A demand and supply analysis of protectionism shows that it is not just a matter of domestic gains and foreign losses, but a policy that imposes substantial domestic costs as well.

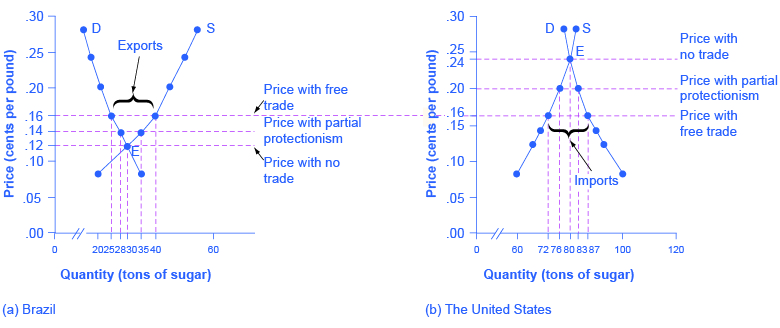
Consider two countries, Brazil and the United States, who produce sugar. Each country has a domestic supply and demand for sugar, as detailed in [link] and illustrated in [link] . In Brazil, without trade, the equilibrium    price of sugar is 12 cents per pound and the equilibrium output is 30 tons. When there is no trade in the United States, the equilibrium price of sugar is 24 cents per pound and the equilibrium quantity is 80 tons. These equilibrium points are labeled with the point E.

The sugar trade between brazil and the united states

This is a two-panel demand and supply graph, with quantity of sugar on the x-axis and price of sugar measured in cents per pound on the y-axis. The price-quantity pairs are plotted using the numbers from Table 34_01. The graph shows three sets of price outcomes in each country: no trade, free trade, and price with partial protectionism. The no-trade price in Brazil is lower than in the United States. Hence, when countries can engage in trade, the free-trade price will rise in Brazil and decrease in the United States.
Before trade, the equilibrium price of sugar in Brazil is 12 cents a pound and for 24 cents per pound in the United States. When trade is allowed, businesses will buy cheap sugar in Brazil and sell it in the United States. This will result in higher prices in Brazil and lower prices in the United States. Ignoring transaction costs, prices should converge to 16 cents per pound, with Brazil exporting 15 tons of sugar and the United States importing 15 tons of sugar. If trade is only partly open between the countries, it will lead to an outcome between the free-trade and no-trade possibilities.

Questions & Answers

how do you get the 2/50
Abba Reply
number of sport play by 50 student construct discrete data
Aminu Reply
width of the frangebany leaves on how to write a introduction
Theresa Reply
Solve the mean of variance
Veronica Reply
Step 1: Find the mean. To find the mean, add up all the scores, then divide them by the number of scores. ... Step 2: Find each score's deviation from the mean. ... Step 3: Square each deviation from the mean. ... Step 4: Find the sum of squares. ... Step 5: Divide the sum of squares by n – 1 or N.
kenneth
what is error
Yakuba Reply
Is mistake done to something
Vutshila
Hy
anas
hy
What is the life teble
anas
hy
Jibrin
statistics is the analyzing of data
Tajudeen Reply
what is statics?
Zelalem Reply
how do you calculate mean
Gloria Reply
diveving the sum if all values
Shaynaynay
let A1,A2 and A3 events be independent,show that (A1)^c, (A2)^c and (A3)^c are independent?
Fisaye Reply
what is statistics
Akhisani Reply
data collected all over the world
Shaynaynay
construct a less than and more than table
Imad Reply
The sample of 16 students is taken. The average age in the sample was 22 years with astandard deviation of 6 years. Construct a 95% confidence interval for the age of the population.
Aschalew Reply
Bhartdarshan' is an internet-based travel agency wherein customer can see videos of the cities they plant to visit. The number of hits daily is a normally distributed random variable with a mean of 10,000 and a standard deviation of 2,400 a. what is the probability of getting more than 12,000 hits? b. what is the probability of getting fewer than 9,000 hits?
Akshay Reply
Bhartdarshan'is an internet-based travel agency wherein customer can see videos of the cities they plan to visit. The number of hits daily is a normally distributed random variable with a mean of 10,000 and a standard deviation of 2,400. a. What is the probability of getting more than 12,000 hits
Akshay
1
Bright
Sorry i want to learn more about this question
Bright
Someone help
Bright
a= 0.20233 b=0.3384
Sufiyan
a
Shaynaynay
How do I interpret level of significance?
Mohd Reply
It depends on your business problem or in Machine Learning you could use ROC- AUC cruve to decide the threshold value
Shivam
how skewness and kurtosis are used in statistics
Owen Reply
yes what is it
Taneeya
Got questions? Join the online conversation and get instant answers!
Jobilize.com Reply

Get Jobilize Job Search Mobile App in your pocket Now!

Get it on Google Play Download on the App Store Now


Source:  OpenStax, Microeconomics. OpenStax CNX. Aug 03, 2014 Download for free at http://legacy.cnx.org/content/col11627/1.10
Google Play and the Google Play logo are trademarks of Google Inc.

Notification Switch

Would you like to follow the 'Microeconomics' conversation and receive update notifications?

Ask