

| << Chapter < Page | Chapter >> Page > |
In the northern blot , another variation of the Southern blot, RNA (not DNA) is immobilized on the membrane and probed. Northern blots are typically used to detect the amount of mRNA made through gene expression within a tissue or organism sample.
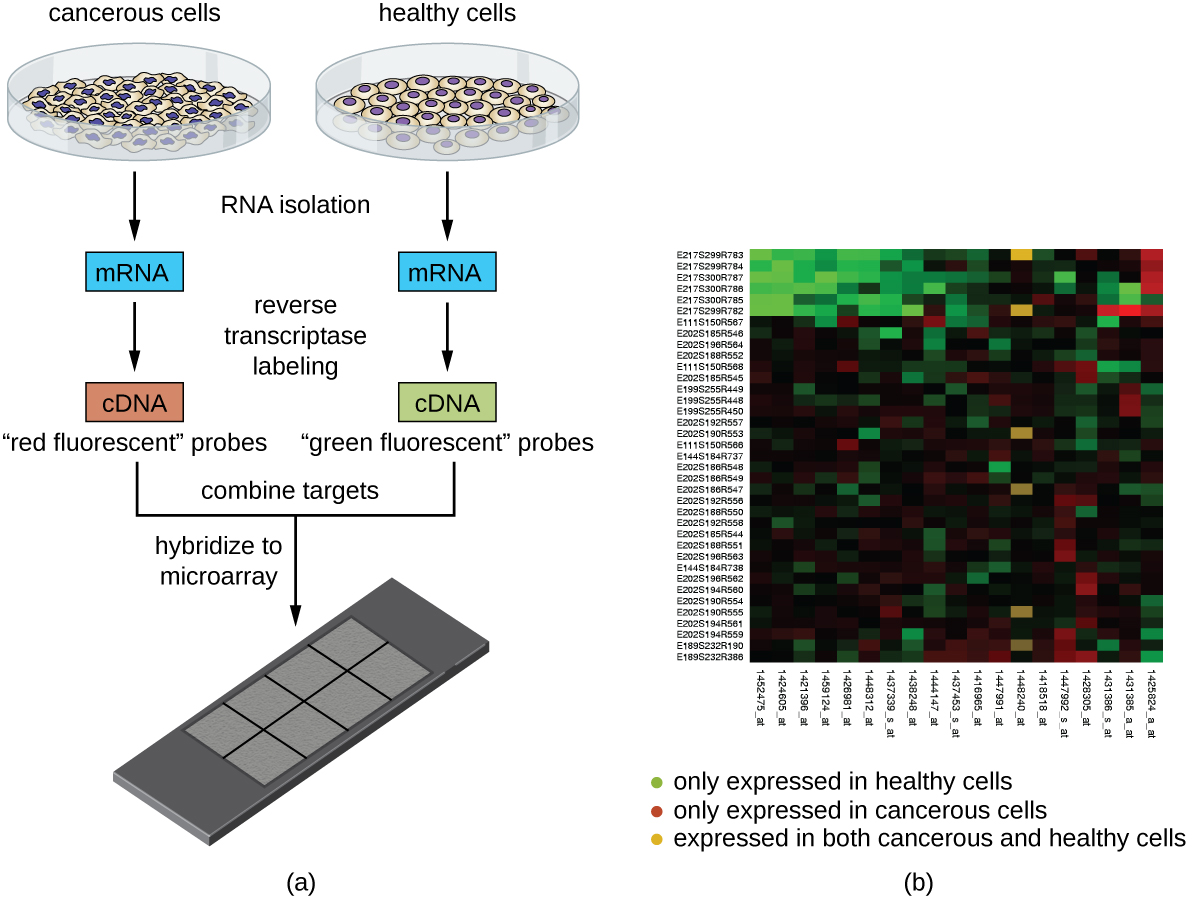
Another technique that capitalizes on the hybridization between complementary nucleic acid sequences is called microarray analysis . Microarray analysis is useful for the comparison of gene-expression patterns between different cell types—for example, cells infected with a virus versus uninfected cells, or cancerous cells versus healthy cells ( [link] ).
Typically, DNA or cDNA from an experimental sample is deposited on a glass slide alongside known DNA sequences. Each slide can hold more than 30,000 different DNA fragment types. Distinct DNA fragments (encompassing an organism’s entire genomic library) or cDNA fragments (corresponding to an organism’s full complement of expressed genes) can be individually spotted on a glass slide.
Once deposited on the slide, genomic DNA or mRNA can be isolated from the two samples for comparison. If mRNA is isolated, it is reverse-transcribed to cDNA using reverse transcriptase. Then the two samples of genomic DNA or cDNA are labeled with different fluorescent dyes (typically red and green). The labeled genomic DNA samples are then combined in equal amounts, added to the microarray chip, and allowed to hybridize to complementary spots on the microarray.
Hybridization of sample genomic DNA molecules can be monitored by measuring the intensity of fluorescence at particular spots on the microarray. Differences in the amount of hybridization between the samples can be readily observed. If only one sample’s nucleic acids hybridize to a particular spot on the microarray, then that spot will appear either green or red. However, if both samples’ nucleic acids hybridize, then the spot will appear yellow due to the combination of the red and green dyes.
Although microarray technology allows for a holistic comparison between two samples in a short time, it requires sophisticated (and expensive) detection equipment and analysis software. Because of the expense, this technology is typically limited to research settings. Researchers have used microarray analysis to study how gene expression is affected in organisms that are infected by bacteria or viruses or subjected to certain chemical treatments.

Explore microchip technology at this interactive website.
Notification Switch
Would you like to follow the 'Microbiology' conversation and receive update notifications?

|
|

|
|

|
|

|
|
|
|
|

|
|

|
|

|
|
|
|
|

|