<< Chapter < Page Chapter >> Page >

Shift in supply

We know that a supply curve shows the minimum price a firm will accept to produce a given quantity of output. What happens to the supply curve when the cost of production goes up? Following is an example of a shift in supply due to a production cost increase.

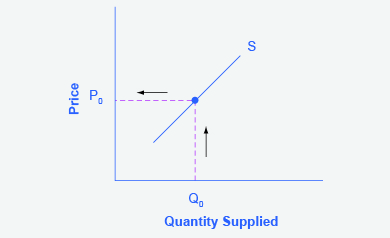
Step 1. Draw a graph of a supply curve for pizza. Pick a quantity (like Q 0 ). If you draw a vertical line up from Q 0 to the supply curve, you will see the price the firm chooses. An example is shown in [link] .

Suppy curve

The graph represents the directions for step 1. A supply curve shows the minimum price a firm will accept (P sub 0) to supply a given quantity of output (Q sub 0).
The supply curve can be used to show the minimum price a firm will accept to produce a given quantity of output.

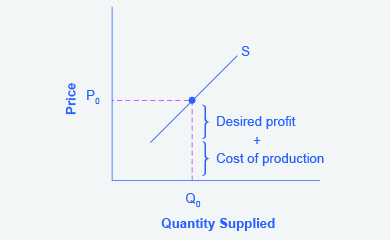
Step 2. Why did the firm choose that price and not some other? One way to think about this is that the price is composed of two parts. The first part is the average cost of production, in this case, the cost of the pizza ingredients (dough, sauce, cheese, pepperoni, and so on), the cost of the pizza oven, the rent on the shop, and the wages of the workers. The second part is the firm’s desired profit, which is determined, among other factors, by the profit margins in that particular business. If you add these two parts together, you get the price the firm wishes to charge. The quantity Q0 and associated price P0 give you one point on the firm’s supply curve, as shown in [link] .

Setting prices

The graph represents the directions for step 2. For a given quantity of output (Q sub 0), the firm wishes to charge a price (P sub 0) equal to the cost of production plus the desired profit margin.
The cost of production and the desired profit equal the price a firm will set for a product.

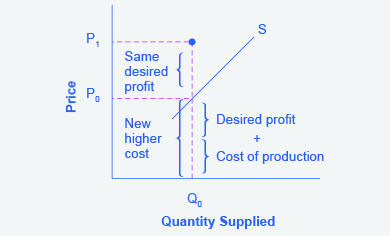
Step 3. Now, suppose that the cost of production goes up. Perhaps cheese has become more expensive by $0.75 per pizza. If that is true, the firm will want to raise its price by the amount of the increase in cost ($0.75). Draw this point on the supply curve directly above the initial point on the curve, but $0.75 higher, as shown in [link] .

Increasing costs leads to increasing price

The graph represents the directions for step 3. An increase in production cost will raise the price a firm wishes to charge (to P sub 1) for a given quantity of output (Q sub 0).
Because the cost of production and the desired profit equal the price a firm will set for a product, if the cost of production increases, the price for the product will also need to increase.

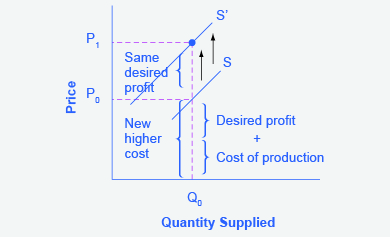
Step 4. Shift the supply curve through this point. You will see that an increase in cost causes an upward (or a leftward) shift of the supply curve so that at any price, the quantities supplied will be smaller, as shown in [link] .

Supply curve shifts

The graph represents the directions for step 4. An increase in the cost of production will shift the supply curve vertically by the amount of the cost increase.
When the cost of production increases, the supply curve shifts upwardly to a new price level.

Summing up factors that change supply

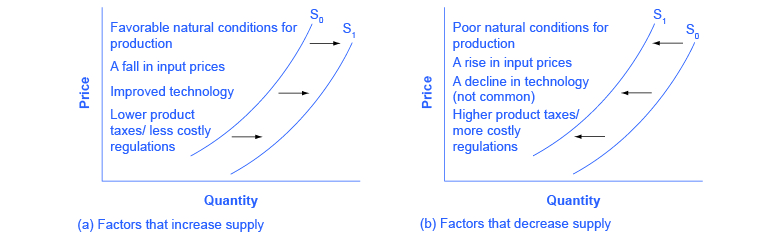
Changes in the cost of inputs, natural disasters, new technologies, and the impact of government decisions all affect the cost of production. In turn, these factors affect how much firms are willing to supply at any given price.

[link] summarizes factors that change the supply of goods and services. Notice that a change in the price of the product itself is not among the factors that shift the supply curve. Although a change in price of a good or service typically causes a change in quantity supplied or a movement along the supply curve for that specific good or service, it does not cause the supply curve itself to shift.

Factors that shift supply curves

The graph on the left lists events that could lead to increased supply. The graph on the right lists events that could lead to decreased supply.
(a) A list of factors that can cause an increase in supply from S 0 to S 1 . (b) The same factors, if their direction is reversed, can cause a decrease in supply from S 0 to S 1 .

Because demand and supply curves appear on a two-dimensional diagram with only price and quantity on the axes, an unwary visitor to the land of economics might be fooled into believing that economics is about only four topics: demand, supply, price, and quantity. However, demand and supply are really “umbrella” concepts: demand covers all the factors that affect demand, and supply covers all the factors that affect supply. Factors other than price that affect demand and supply are included by using shifts in the demand or the supply curve. In this way, the two-dimensional demand and supply model becomes a powerful tool for analyzing a wide range of economic circumstances.

Key concepts and summary

Economists often use the ceteris paribus or “other things being equal” assumption: while examining the economic impact of one event, all other factors remain unchanged for the purpose of the analysis. Factors that can shift the demand curve for goods and services, causing a different quantity to be demanded at any given price, include changes in tastes, population, income, prices of substitute or complement goods, and expectations about future conditions and prices. Factors that can shift the supply curve for goods and services, causing a different quantity to be supplied at any given price, include input prices, natural conditions, changes in technology, and government taxes, regulations, or subsidies.

Problems

[link] shows information on the demand and supply for bicycles, where the quantities of bicycles are measured in thousands.

Price Qd Qs
$120 50 36
$150 40 40
$180 32 48
$210 28 56
$240 24 70
  1. What is the quantity demanded and the quantity supplied at a price of $210?
  2. At what price is the quantity supplied equal to 48,000?
  3. Graph the demand and supply curve for bicycles. How can you determine the equilibrium price and quantity from the graph? How can you determine the equilibrium price and quantity from the table? What are the equilibrium price and equilibrium quantity?
  4. If the price was $120, what would the quantities demanded and supplied be? Would a shortage or surplus exist? If so, how large would the shortage or surplus be?
Got questions? Get instant answers now!

The computer market in recent years has seen many more computers sell at much lower prices. What shift in demand or supply is most likely to explain this outcome? Sketch a demand and supply diagram and explain your reasoning for each.

  1. A rise in demand
  2. A fall in demand
  3. A rise in supply
  4. A fall in supply

Got questions? Get instant answers now!

References

Landsburg, Steven E. The Armchair Economist: Economics and Everyday Life . New York: The Free Press. 2012. specifically Section IV: How Markets Work.

National Chicken Council. 2015. "Per Capita Consumption of Poultry and Livestock, 1965 to Estimated 2015, in Pounds." Accessed April 13, 2015. http://www.nationalchickencouncil.org/about-the-industry/statistics/per-capita-consumption-of-poultry-and-livestock-1965-to-estimated-2012-in-pounds/.

Wessel, David. “Saudi Arabia Fears $40-a-Barrel Oil, Too.” The Wall Street Journal . May 27, 2004, p. 42. http://online.wsj.com/news/articles/SB108561000087822300.

Questions & Answers

how do you get the 2/50
Abba Reply
number of sport play by 50 student construct discrete data
Aminu Reply
width of the frangebany leaves on how to write a introduction
Theresa Reply
Solve the mean of variance
Veronica Reply
Step 1: Find the mean. To find the mean, add up all the scores, then divide them by the number of scores. ... Step 2: Find each score's deviation from the mean. ... Step 3: Square each deviation from the mean. ... Step 4: Find the sum of squares. ... Step 5: Divide the sum of squares by n – 1 or N.
kenneth
what is error
Yakuba Reply
Is mistake done to something
Vutshila
Hy
anas
hy
What is the life teble
anas
hy
Jibrin
statistics is the analyzing of data
Tajudeen Reply
what is statics?
Zelalem Reply
how do you calculate mean
Gloria Reply
diveving the sum if all values
Shaynaynay
let A1,A2 and A3 events be independent,show that (A1)^c, (A2)^c and (A3)^c are independent?
Fisaye Reply
what is statistics
Akhisani Reply
data collected all over the world
Shaynaynay
construct a less than and more than table
Imad Reply
The sample of 16 students is taken. The average age in the sample was 22 years with astandard deviation of 6 years. Construct a 95% confidence interval for the age of the population.
Aschalew Reply
Bhartdarshan' is an internet-based travel agency wherein customer can see videos of the cities they plant to visit. The number of hits daily is a normally distributed random variable with a mean of 10,000 and a standard deviation of 2,400 a. what is the probability of getting more than 12,000 hits? b. what is the probability of getting fewer than 9,000 hits?
Akshay Reply
Bhartdarshan'is an internet-based travel agency wherein customer can see videos of the cities they plan to visit. The number of hits daily is a normally distributed random variable with a mean of 10,000 and a standard deviation of 2,400. a. What is the probability of getting more than 12,000 hits
Akshay
1
Bright
Sorry i want to learn more about this question
Bright
Someone help
Bright
a= 0.20233 b=0.3384
Sufiyan
a
Shaynaynay
How do I interpret level of significance?
Mohd Reply
It depends on your business problem or in Machine Learning you could use ROC- AUC cruve to decide the threshold value
Shivam
how skewness and kurtosis are used in statistics
Owen Reply
yes what is it
Taneeya
Got questions? Join the online conversation and get instant answers!
Jobilize.com Reply

Get Jobilize Job Search Mobile App in your pocket Now!

Get it on Google Play Download on the App Store Now


Source:  OpenStax, Macroeconomics. OpenStax CNX. Jun 16, 2014 Download for free at http://legacy.cnx.org/content/col11626/1.10
Google Play and the Google Play logo are trademarks of Google Inc.

Notification Switch

Would you like to follow the 'Macroeconomics' conversation and receive update notifications?

Ask