<< Chapter < Page Chapter >> Page >

The most common way price supports work is that the government enters the market and buys up the product, adding to demand to keep prices higher than they otherwise would be. According to the Common Agricultural Policy reform passed in 2013, the European Union (EU) will spend about 60 billion euros per year, or 67 billion dollars per year, or roughly 38% of the EU budget, on price supports for Europe’s farmers from 2014 to 2020.

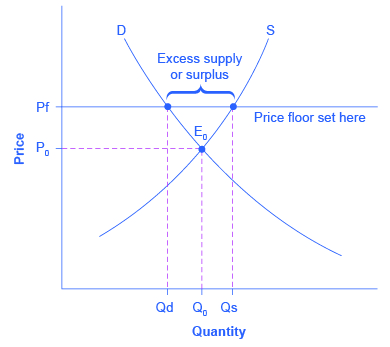
[link] illustrates the effects of a government program that assures a price above the equilibrium by focusing on the market for wheat in Europe. In the absence of government intervention, the price would adjust so that the quantity supplied would equal the quantity demanded at the equilibrium point E 0 , with price P 0 and quantity Q 0 . However, policies to keep prices high for farmers keeps the price above what would have been the market equilibrium level—the price Pf shown by the dashed horizontal line in the diagram. The result is a quantity supplied in excess of the quantity demanded (Qd). When quantity supplied exceeds quantity demanded, a surplus exists.

The high-income areas of the world, including the United States, Europe, and Japan, are estimated to spend roughly $1 billion per day in supporting their farmers. If the government is willing to purchase the excess supply (or to provide payments for others to purchase it), then farmers will benefit from the price floor, but taxpayers and consumers of food will pay the costs. Numerous proposals have been offered for reducing farm subsidies. In many countries, however, political support for subsidies for farmers remains strong. Either because this is viewed by the population as supporting the traditional rural way of life or because of the lobbying power of the agro-business industry.

For more detail on the effects price ceilings and floors have on demand and supply, see the following Clear It Up feature.

European wheat prices: a price floor example

The graph shows an example of a price floor which results in a surplus.
The intersection of demand (D) and supply (S) would be at the equilibrium point E 0 . However, a price floor set at Pf holds the price above E 0 and prevents it from falling. The result of the price floor is that the quantity supplied Qs exceeds the quantity demanded Qd. There is excess supply, also called a surplus.

Do price ceilings and floors change demand or supply?

Neither price ceilings nor price floors cause demand or supply to change. They simply set a price that limits what can be legally charged in the market. Remember, changes in price do not cause demand or supply to change. Price ceilings and price floors can cause a different choice of quantity demanded along a demand curve, but they do not move the demand curve. Price controls can cause a different choice of quantity supplied along a supply curve, but they do not shift the supply curve.

Key concepts and summary

Price ceilings prevent a price from rising above a certain level. When a price ceiling is set below the equilibrium price, quantity demanded will exceed quantity supplied, and excess demand or shortages will result. Price floors prevent a price from falling below a certain level. When a price floor is set above the equilibrium price, quantity supplied will exceed quantity demanded, and excess supply or surpluses will result. Price floors and price ceilings often lead to unintended consequences.

Problems

A low-income country decides to set a price ceiling on bread so it can make sure that bread is affordable to the poor. The conditions of demand and supply are given in [link] . What are the equilibrium price and equilibrium quantity before the price ceiling? What will the excess demand or the shortage (that is, quantity demanded minus quantity supplied) be if the price ceiling is set at $2.40? At $2.00? At $3.60?

Price Qd Qs
$1.60 9,000 5,000
$2.00 8,500 5,500
$2.40 8,000 6,400
$2.80 7,500 7,500
$3.20 7,000 9,000
$3.60 6,500 11,000
$4.00 6,000 15,000
Got questions? Get instant answers now!

Questions & Answers

it is the relatively stable flow of income
Chidubem Reply
what is circular flow of income
Divine Reply
branches of macroeconomics
SHEDRACK Reply
what is Flexible exchang rate?
poudel Reply
is gdp a reliable measurement of wealth
Atega Reply
introduction to econometrics
Husseini Reply
Hi
mostafa
hi
LEMLEM
hello
Sammol
hi
Mahesh
bi
Ruqayat
hi
Ruqayat
Hi fellas
Nyawa
hey
Sammol
hi
God
hello
Jahara
Good morning
Jorge
hi
abubakar
hi
Nmesoma
hi
Mahesh
Hi
Tom
Why is unemployment rate never zero at full employment?
Priyanka Reply
bcoz of existence of frictional unemployment in our economy.
Umashankar
what is flexible exchang rate?
poudel
due to existence of the pple with disabilities
Abdulraufu
the demand of a good rises, causing the demand for another good to fall
Rushawn Reply
is it possible to leave every good at the same level
Joseph
I don't think so. because check it, if the demand for chicken increases, people will no longer consume fish like they used to causing a fall in the demand for fish
Anuolu
is not really possible to let the value of a goods to be same at the same time.....
Salome
Suppose the inflation rate is 6%, does it mean that all the goods you purchase will cost 6% more than previous year? Provide with reasoning.
Geetha Reply
Not necessarily. To measure the inflation rate economists normally use an averaged price index of a basket of certain goods. So if you purchase goods included in the basket, you will notice that you pay 6% more, otherwise not necessarily.
Waeth
discus major problems of macroeconomics
Alii Reply
what is the problem of macroeconomics
Yoal
Economic growth Stable prices and low unemployment
Ephraim
explain inflationcause and itis degre
Miresa Reply
what is inflation
Getu
increase in general price levels
WEETO
Good day How do I calculate this question: C= 100+5yd G= 2000 T= 2000 I(planned)=200. Suppose the actual output is 3000. What is the level of planned expenditures at this level of output?
Chisomo Reply
how to calculate actual output?
Chisomo
how to calculate the equilibrium income
Beshir
Criteria for determining money supply
Thapase Reply
who we can define macroeconomics in one line
Muhammad
Aggregate demand
Mohammed
C=k100 +9y and i=k50.calculate the equilibrium level of output
Mercy Reply
Hi
Isiaka
Hi
Geli
hy
Man
👋
Bahunda
hy how are you?
Man
ys
Amisha
how are you guys
Sekou
f9 guys
Amisha
how are you guys
Sekou
ys am also fine
Amisha
fine and you guys
Geli
from Nepal
Amisha
nawalparasi district from belatari
Amisha
nd u
Amisha
I am Camara from Guinea west Africa... happy to meet you guys here
Sekou
ma management ho
Amisha
ahile becheclor ho
Amisha
hjr ktm bta ho ani k kaam grnu hunxa tw
Amisha
belatari
Amisha
1st year ho
Amisha
nd u
Amisha
ahh
Amisha
kaha biratnagar
Amisha
ys
Amisha
kina k vo
Amisha
money as unit of account means what?
Kalombe
A unit of account is something that can be used to value goods and services and make calculations
Jim
all of you please speak in English I can't understand you're language
Muhammad
I want to know how can we define macroeconomics in one line
Muhammad
it must be .9 or 0.9 no Mpc is greater than 1 Y=100+.9Y+50 Y-.9Y=150 0.1Y/0.1=150/0.1 Y=1500
Kalombe
Mercy is it clear?😋
Kalombe
hi can someone help me on this question If a negative shocks shifts the IS curve to the left, what type of policy do you suggest so as to stabilize the level of output? discuss your answer using appropriate graph.
Galge Reply
if interest rate is increased this will will reduce the level of income shifting the curve to the left ◀️
Kalombe

Get Jobilize Job Search Mobile App in your pocket Now!

Get it on Google Play Download on the App Store Now


Source:  OpenStax, Macroeconomics. OpenStax CNX. Jun 16, 2014 Download for free at http://legacy.cnx.org/content/col11626/1.10
Google Play and the Google Play logo are trademarks of Google Inc.

Notification Switch

Would you like to follow the 'Macroeconomics' conversation and receive update notifications?

Ask