<< Chapter < Page Chapter >> Page >

Capital deepening

When society increases the level of capital per person, the result is called capital deepening    . The idea of capital deepening can apply both to additional human capital per worker and to additional physical capital per worker.

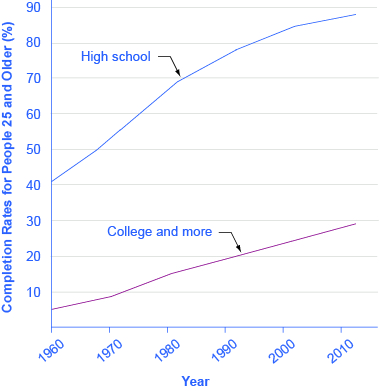
Recall that one way to measure human capital is to look at the average levels of education in an economy. [link] illustrates the human capital deepening for U.S. workers by showing that the proportion of the U.S. population with a high school and a college degree is rising. As recently as 1970, for example, only about half of U.S. adults had at least a high school diploma; by the start of the twenty-first century, more than 80% of adults had graduated from high school. The idea of human capital deepening also applies to the years of experience that workers have, but the average experience level of U.S. workers has not changed much in recent decades. Thus, the key dimension for deepening human capital in the U.S. economy focuses more on additional education and training than on a higher average level of work experience.

Human capital deepening in the u.s.

The graph shows that people 25 and older have relatively high completion rates for high school education, nearing 90%, while completion rates for college education or more are around 30%.
Rising levels of education for persons 25 and older show the deepening of human capital in the U.S. economy. Even today, relatively few U.S. adults have completed a four-year college degree. There is clearly room for additional deepening of human capital to occur. (Source: US Department of Education, National Center for Education Statistics)

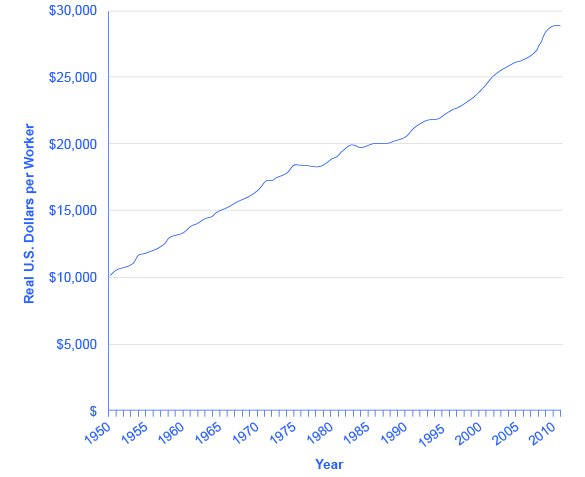
Physical capital deepening in the U.S. economy is shown in [link] . The average U.S. worker in the late 2000s was working with physical capital worth almost three times as much as that of the average worker of the early 1950s.

Physical capital per worker in the united states

The graph shows that physical capital per worker in the United States has consistently increased since 1950. As of 2011, physical capital per worker is $28,861. In 1950, the amount was $10,195.
The value of the physical capital, measured by plant and equipment, used by the average worker in the U.S. economy has risen over the decades. The increase may have leveled off a bit in the 1970s and 1980s, which were not, coincidentally, times of slower-than-usual growth in worker productivity. We see a renewed increase in physical capital per worker in the late 1990s, followed by a flattening in the early 2000s. (Source: Center for International Comparisons of Production, Income and Prices, University of Pennsylvania)

Not only does the current U.S. economy have better-educated workers with more and improved physical capital than it did several decades ago, but these workers have access to more advanced technologies. Growth in technology is impossible to measure with a simple line on a graph, but evidence that we live in an age of technological marvels is all around us—discoveries in genetics and in the structure of particles, the wireless Internet, and other inventions almost too numerous to count. The U.S. Patent and Trademark Office typically has issued more than 150,000 patents annually in recent years.

This recipe for economic growth—investing in labor productivity, with investments in human capital and technology, as well as increasing physical capital—also applies to other economies. In South Korea, for example, universal enrollment in primary school (the equivalent of kindergarten through sixth grade in the United States) had already been achieved by 1965, when Korea’s GDP per capita was still near its rock bottom low. By the late 1980s, Korea had achieved almost universal secondary school education (the equivalent of a high school education in the United States). With regard to physical capital, Korea’s rates of investment had been about 15% of GDP at the start of the 1960s, but doubled to 30–35% of GDP by the late 1960s and early 1970s. With regard to technology, South Korean students went to universities and colleges around the world to get scientific and technical training, and South Korean firms reached out to study and form partnerships with firms that could offer them technological insights. These factors combined to foster South Korea’s high rate of economic growth.

Questions & Answers

it is the relatively stable flow of income
Chidubem Reply
what is circular flow of income
Divine Reply
branches of macroeconomics
SHEDRACK Reply
what is Flexible exchang rate?
poudel Reply
is gdp a reliable measurement of wealth
Atega Reply
introduction to econometrics
Husseini Reply
Hi
mostafa
hi
LEMLEM
hello
Sammol
hi
Mahesh
bi
Ruqayat
hi
Ruqayat
Hi fellas
Nyawa
hey
Sammol
hi
God
hello
Jahara
Good morning
Jorge
hi
abubakar
hi
Nmesoma
hi
Mahesh
Hi
Tom
Why is unemployment rate never zero at full employment?
Priyanka Reply
bcoz of existence of frictional unemployment in our economy.
Umashankar
what is flexible exchang rate?
poudel
due to existence of the pple with disabilities
Abdulraufu
the demand of a good rises, causing the demand for another good to fall
Rushawn Reply
is it possible to leave every good at the same level
Joseph
I don't think so. because check it, if the demand for chicken increases, people will no longer consume fish like they used to causing a fall in the demand for fish
Anuolu
is not really possible to let the value of a goods to be same at the same time.....
Salome
Suppose the inflation rate is 6%, does it mean that all the goods you purchase will cost 6% more than previous year? Provide with reasoning.
Geetha Reply
Not necessarily. To measure the inflation rate economists normally use an averaged price index of a basket of certain goods. So if you purchase goods included in the basket, you will notice that you pay 6% more, otherwise not necessarily.
Waeth
discus major problems of macroeconomics
Alii Reply
what is the problem of macroeconomics
Yoal
Economic growth Stable prices and low unemployment
Ephraim
explain inflationcause and itis degre
Miresa Reply
what is inflation
Getu
increase in general price levels
WEETO
Good day How do I calculate this question: C= 100+5yd G= 2000 T= 2000 I(planned)=200. Suppose the actual output is 3000. What is the level of planned expenditures at this level of output?
Chisomo Reply
how to calculate actual output?
Chisomo
how to calculate the equilibrium income
Beshir
Criteria for determining money supply
Thapase Reply
who we can define macroeconomics in one line
Muhammad
Aggregate demand
Mohammed
C=k100 +9y and i=k50.calculate the equilibrium level of output
Mercy Reply
Hi
Isiaka
Hi
Geli
hy
Man
👋
Bahunda
hy how are you?
Man
ys
Amisha
how are you guys
Sekou
f9 guys
Amisha
how are you guys
Sekou
ys am also fine
Amisha
fine and you guys
Geli
from Nepal
Amisha
nawalparasi district from belatari
Amisha
nd u
Amisha
I am Camara from Guinea west Africa... happy to meet you guys here
Sekou
ma management ho
Amisha
ahile becheclor ho
Amisha
hjr ktm bta ho ani k kaam grnu hunxa tw
Amisha
belatari
Amisha
1st year ho
Amisha
nd u
Amisha
ahh
Amisha
kaha biratnagar
Amisha
ys
Amisha
kina k vo
Amisha
money as unit of account means what?
Kalombe
A unit of account is something that can be used to value goods and services and make calculations
Jim
all of you please speak in English I can't understand you're language
Muhammad
I want to know how can we define macroeconomics in one line
Muhammad
it must be .9 or 0.9 no Mpc is greater than 1 Y=100+.9Y+50 Y-.9Y=150 0.1Y/0.1=150/0.1 Y=1500
Kalombe
Mercy is it clear?😋
Kalombe
hi can someone help me on this question If a negative shocks shifts the IS curve to the left, what type of policy do you suggest so as to stabilize the level of output? discuss your answer using appropriate graph.
Galge Reply
if interest rate is increased this will will reduce the level of income shifting the curve to the left ◀️
Kalombe

Get Jobilize Job Search Mobile App in your pocket Now!

Get it on Google Play Download on the App Store Now


Source:  OpenStax, Macroeconomics. OpenStax CNX. Jun 16, 2014 Download for free at http://legacy.cnx.org/content/col11626/1.10
Google Play and the Google Play logo are trademarks of Google Inc.

Notification Switch

Would you like to follow the 'Macroeconomics' conversation and receive update notifications?

Ask