Explain historical patterns of unemployment in the U.S.
Identify trends of unemployment based on demographics
Evaluate global unemployment rates
Let’s look at how unemployment rates have changed over time and how various groups of people are affected by unemployment differently.
The historical u.s. unemployment rate
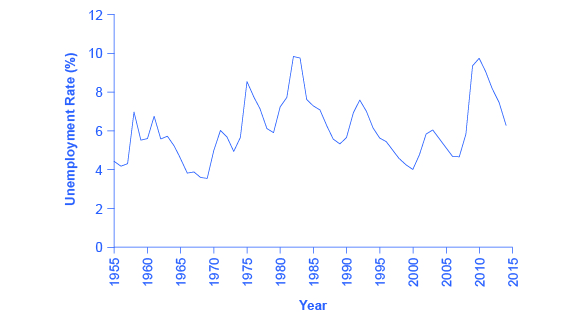
[link] shows the historical pattern of U.S. unemployment since 1955.
The u.s. unemployment rate, 1955–2015
The U.S. unemployment rate moves up and down as the economy moves in and out of recessions. But over time, the unemployment rate seems to return to a range of 4% to 6%. There does not seem to be a long-term trend toward the rate moving generally higher or generally lower. (Source:
Federal Reserve Economic Data (FRED) https://research.stlouisfed.org/fred2/series/LRUN64TTUSA156S0)
As we look at this data, several patterns stand out:
Unemployment rates do fluctuate over time. During the deep recessions of the early 1980s and of 2007–2009, unemployment reached roughly 10%. For comparison, during the Great Depression of the 1930s, the unemployment rate reached almost 25% of the labor force.
Unemployment rates in the late 1990s and into the mid-2000s were rather low by historical standards. The unemployment rate was below 5% from 1997 to 2000 and near 5% during almost all of 2006–2007. The previous time unemployment had been less than 5% for three consecutive years was three decades earlier, from 1968 to 1970.
The unemployment rate never falls all the way to zero. Indeed, it never seems to get below 3%—and it stays that low only for very short periods. (Reasons why this is the case are discussed later in this chapter.)
The timing of rises and falls in unemployment matches fairly well with the timing of upswings and downswings in the overall economy. During periods of
recession and
depression , unemployment is high. During periods of economic growth, unemployment tends to be lower.
No significant upward or downward trend in unemployment rates is apparent. This point is especially worth noting because the U.S. population nearly quadrupled from 76 million in 1900 to over 314 million by 2012. Moreover, a higher proportion of U.S. adults are now in the paid workforce, because women have entered the paid labor force in significant numbers in recent decades. Women composed 18% of the paid workforce in 1900 and nearly half of the paid workforce in 2012. But despite the increased number of workers, as well as other economic events like globalization and the continuous invention of new technologies, the economy has provided jobs without causing any long-term upward or downward trend in unemployment rates.
Unemployment rates by group
Unemployment is not distributed evenly across the U.S. population.
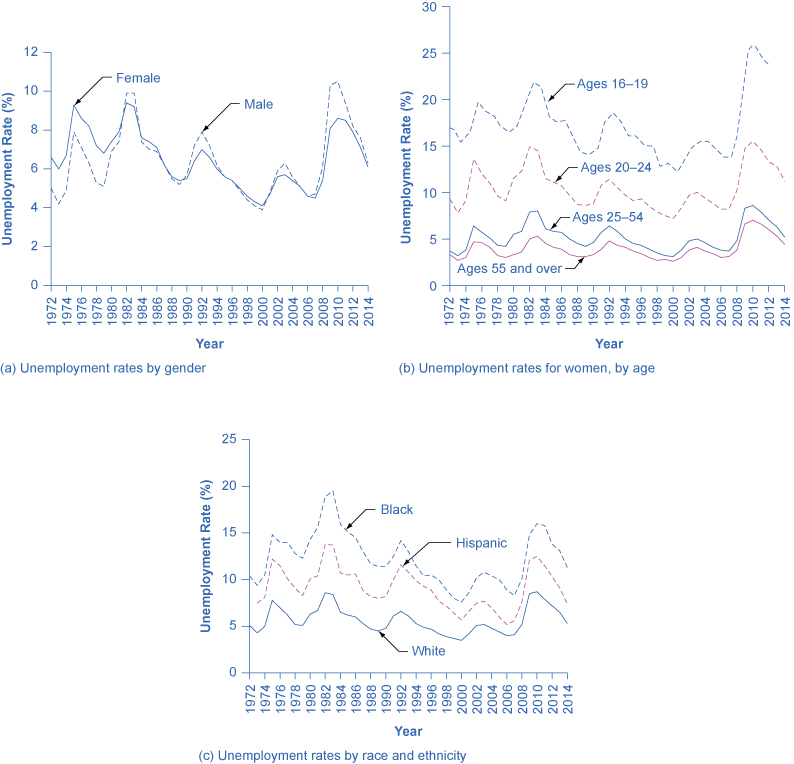
[link] shows unemployment rates broken down in various ways: by gender, age, and race/ethnicity.
Unemployment rate by demographic group
(a) By gender, 1972–2014. Unemployment rates for men used to be lower than unemployment rates for women, but in recent decades, the two rates have been very close, often with the unemployment rate for men somewhat higher. (b) By age, 1972–2014. Unemployment rates are highest for the very young and become lower with age. (c) By race and ethnicity, 1972–2014. Although unemployment rates for all groups tend to rise and fall together, the unemployment rate for whites has been lower than the unemployment rate for blacks and Hispanics in recent decades. (Source: www.bls.gov)
is it possible to leave every good at the same level
Joseph
I don't think so. because check it, if the demand for chicken increases, people will no longer consume fish like they used to causing a fall in the demand for fish
Anuolu
is not really possible to let the value of a goods to be same at the same time.....
Salome
Suppose the inflation rate is 6%, does it mean that all the goods you purchase will cost
6% more than previous year? Provide with reasoning.
Not necessarily. To measure the inflation rate economists normally use an averaged price index of a basket of certain goods. So if you purchase goods included in the basket, you will notice that you pay 6% more, otherwise not necessarily.
Good day
How do I calculate this question: C= 100+5yd G= 2000 T= 2000 I(planned)=200.
Suppose the actual output is 3000. What is the level of planned expenditures at this level of output?
I am Camara from Guinea west Africa... happy to meet you guys here
Sekou
ma management ho
Amisha
ahile becheclor ho
Amisha
hjr ktm bta ho
ani k kaam grnu hunxa tw
Amisha
belatari
Amisha
1st year ho
Amisha
nd u
Amisha
ahh
Amisha
kaha biratnagar
Amisha
ys
Amisha
kina k vo
Amisha
money as unit of account means what?
Kalombe
A unit of account is something that can be used to value goods and services and make calculations
Jim
all of you please speak in English I can't understand you're language
Muhammad
I want to know how can we define macroeconomics in one line
Muhammad
it must be .9 or 0.9
no Mpc is greater than 1
Y=100+.9Y+50
Y-.9Y=150
0.1Y/0.1=150/0.1
Y=1500
Kalombe
Mercy is it clear?😋
Kalombe
hi can someone help me on this question
If a negative shocks shifts the IS curve to the left, what type of policy do you suggest so as to stabilize the level of output?
discuss your answer using appropriate graph.