<< Chapter < Page Chapter >> Page >

Changes in Expectations about Future Prices or Other Factors that Affect Demand

While it is clear that the price of a good affects the quantity demanded, it is also true that expectations about the future price (or expectations about tastes and preferences, income, and so on) can affect demand. For example, if people hear that a hurricane is coming, they may rush to the store to buy flashlight batteries and bottled water. If people learn that the price of a good like coffee is likely to rise in the future, they may head for the store to stock up on coffee now. These changes in demand are shown as shifts in the curve. Therefore, a shift in demand    happens when a change in some economic factor (other than price) causes a different quantity to be demanded at every price. The following Work It Out feature shows how this happens.

Shift in demand

A shift in demand means that at any price (and at every price), the quantity demanded will be different than it was before. Following is an example of a shift in demand due to an income increase.

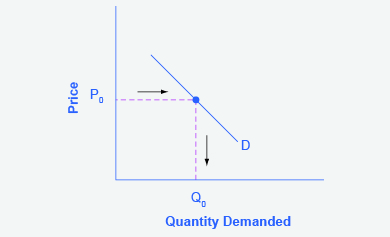
Step 1. Draw the graph of a demand curve for a normal good like pizza. Pick a price (like P 0 ). Identify the corresponding Q 0 . An example is shown in [link] .

Demand curve

The graph represents the directions for step 1.A demand curve shows how much consumers would be willing to buy at any given price.
The demand curve can be used to identify how much consumers would buy at any given price.

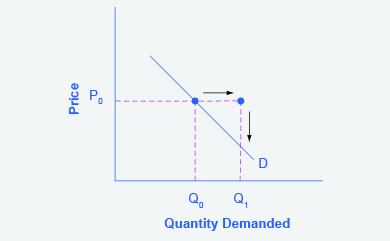
Step 2. Suppose income increases. As a result of the change, are consumers going to buy more or less pizza? The answer is more. Draw a dotted horizontal line from the chosen price, through the original quantity demanded, to the new point with the new Q 1 . Draw a dotted vertical line down to the horizontal axis and label the new Q 1 . An example is provided in [link] .

Demand curve with income increase

The graph represents the directions for step 2. With an increased income, consumers will wish to buy a higher quantity (Q sub 1) than they bought with a lower income.
With an increase in income, consumers will purchase larger quantities, pushing demand to the right.

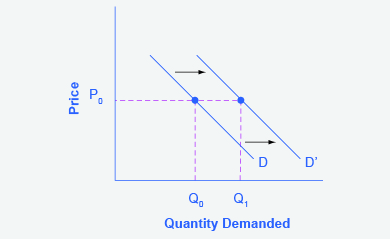
Step 3. Now, shift the curve through the new point. You will see that an increase in income causes an upward (or rightward) shift in the demand curve, so that at any price the quantities demanded will be higher, as shown in [link] .

Demand curve shifted right

The graph represents the directions for step 3. An increased income results in an increase in demand, which is shown by a rightward shift in the demand curve.
With an increase in income, consumers will purchase larger quantities, pushing demand to the right, and causing the demand curve to shift right.

Summing up factors that change demand

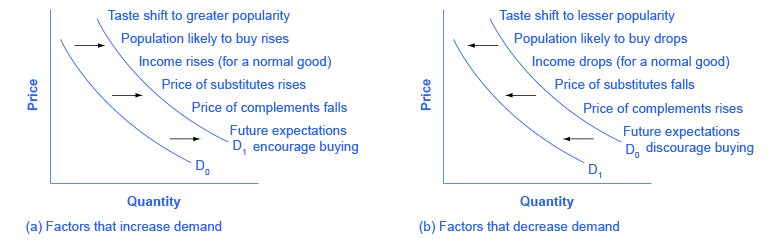
Six factors that can shift demand curves are summarized in [link] . The direction of the arrows indicates whether the demand curve shifts represent an increase in demand or a decrease in demand. Notice that a change in the price of the good or service itself is not listed among the factors that can shift a demand curve. A change in the price of a good or service causes a movement along a specific demand curve, and it typically leads to some change in the quantity demanded, but it does not shift the demand curve.

Factors that shift demand curves

The graph on the left lists events that could lead to increased demand. The graph on the right lists events that could lead to decreased demand.
(a) A list of factors that can cause an increase in demand from D 0 to D 1 . (b) The same factors, if their direction is reversed, can cause a decrease in demand from D 0 to D 1 .

When a demand curve shifts, it will then intersect with a given supply curve at a different equilibrium price and quantity. We are, however, getting ahead of our story. Before discussing how changes in demand can affect equilibrium price and quantity, we first need to discuss shifts in supply curves.

Questions & Answers

A golfer on a fairway is 70 m away from the green, which sits below the level of the fairway by 20 m. If the golfer hits the ball at an angle of 40° with an initial speed of 20 m/s, how close to the green does she come?
Aislinn Reply
cm
tijani
what is titration
John Reply
what is physics
Siyaka Reply
A mouse of mass 200 g falls 100 m down a vertical mine shaft and lands at the bottom with a speed of 8.0 m/s. During its fall, how much work is done on the mouse by air resistance
Jude Reply
Can you compute that for me. Ty
Jude
what is the dimension formula of energy?
David Reply
what is viscosity?
David
what is inorganic
emma Reply
what is chemistry
Youesf Reply
what is inorganic
emma
Chemistry is a branch of science that deals with the study of matter,it composition,it structure and the changes it undergoes
Adjei
please, I'm a physics student and I need help in physics
Adjanou
chemistry could also be understood like the sexual attraction/repulsion of the male and female elements. the reaction varies depending on the energy differences of each given gender. + masculine -female.
Pedro
A ball is thrown straight up.it passes a 2.0m high window 7.50 m off the ground on it path up and takes 1.30 s to go past the window.what was the ball initial velocity
Krampah Reply
2. A sled plus passenger with total mass 50 kg is pulled 20 m across the snow (0.20) at constant velocity by a force directed 25° above the horizontal. Calculate (a) the work of the applied force, (b) the work of friction, and (c) the total work.
Sahid Reply
you have been hired as an espert witness in a court case involving an automobile accident. the accident involved car A of mass 1500kg which crashed into stationary car B of mass 1100kg. the driver of car A applied his brakes 15 m before he skidded and crashed into car B. after the collision, car A s
Samuel Reply
can someone explain to me, an ignorant high school student, why the trend of the graph doesn't follow the fact that the higher frequency a sound wave is, the more power it is, hence, making me think the phons output would follow this general trend?
Joseph Reply
Nevermind i just realied that the graph is the phons output for a person with normal hearing and not just the phons output of the sound waves power, I should read the entire thing next time
Joseph
Follow up question, does anyone know where I can find a graph that accuretly depicts the actual relative "power" output of sound over its frequency instead of just humans hearing
Joseph
"Generation of electrical energy from sound energy | IEEE Conference Publication | IEEE Xplore" ***ieeexplore.ieee.org/document/7150687?reload=true
Ryan
what's motion
Maurice Reply
what are the types of wave
Maurice
answer
Magreth
progressive wave
Magreth
hello friend how are you
Muhammad Reply
fine, how about you?
Mohammed
hi
Mujahid
A string is 3.00 m long with a mass of 5.00 g. The string is held taut with a tension of 500.00 N applied to the string. A pulse is sent down the string. How long does it take the pulse to travel the 3.00 m of the string?
yasuo Reply
Who can show me the full solution in this problem?
Reofrir Reply
Got questions? Join the online conversation and get instant answers!
Jobilize.com Reply

Get Jobilize Job Search Mobile App in your pocket Now!

Get it on Google Play Download on the App Store Now


Source:  OpenStax, Principles of economics. OpenStax CNX. Sep 19, 2014 Download for free at http://legacy.cnx.org/content/col11613/1.11
Google Play and the Google Play logo are trademarks of Google Inc.

Notification Switch

Would you like to follow the 'Principles of economics' conversation and receive update notifications?

Ask