| << Chapter < Page | Chapter >> Page > |
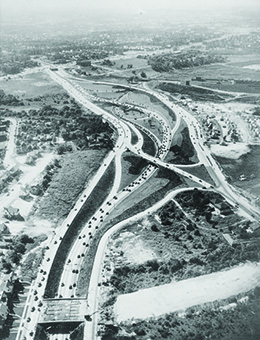
As drivers jammed highways and small streets in record numbers, cities and states rushed to build additional roadways and ease congestion. To help finance these massive construction efforts, states began taxing gasoline, and the federal government provided hundreds of thousands of dollars for the construction of the interstate highway system ( [link] ). The resulting construction projects, designed to make it easier for suburbanites to commute to and from cities, often destroyed urban working-class neighborhoods. Increased funding for highway construction also left less money for public transportation, making it impossible for those who could not afford automobiles to live in the suburbs.

As the government poured money into the defense industry and into universities that conducted research for the government, the economy boomed. The construction and automobile industries employed thousands, as did the industries they relied upon: steel, oil and gasoline refining, rubber, and lumber. As people moved into new homes, their purchases of appliances, carpeting, furniture, and home decorations spurred growth in other industries. The building of miles of roads also employed thousands. Unemployment was low, and wages for members of both the working and middle classes were high.
Following World War II, the majority of white Americans were members of the middle class, based on such criteria as education, income, and home ownership. Even most blue-collar families could afford such elements of a middle-class lifestyle as new cars, suburban homes, and regular vacations. Most African Americans, however, were not members of the middle class. In 1950, the median income for white families was $20,656, whereas for black families it was $11,203. By 1960, when the average white family earned $28,485 a year, blacks still lagged behind at $15,786; nevertheless, this represented a more than 40 percent increase in African American income in the space of a decade.
While working-class men found jobs in factories and on construction crews, those in the middle class often worked for corporations that, as a result of government spending, had grown substantially during World War II and were still getting larger. Such corporations, far too large to allow managers to form personal relationships with all of their subordinates, valued conformity to company rules and standards above all else. In his best-selling book The Organization Man , however, William H. Whyte criticized the notion that conformity was the best path to success and self-fulfillment.
Conformity was still the watchword of suburban life: Many neighborhoods had rules mandating what types of clotheslines could be used and prohibited residents from parking their cars on the street. Above all, conforming to societal norms meant marrying young and having children. In the post-World War II period, marriage rates rose; the average age at first marriage dropped to twenty-three for men and twenty for women. Between 1946 and 1964, married couples also gave birth to the largest generation in U.S. history to date; this baby boom resulted in the cohort known as the baby boomers. Conformity also required that the wives of both working- and middle-class men stay home and raise children instead of working for wages outside the home. Most conformed to this norm, at least while their children were young. Nevertheless, 40 percent of women with young children and half of women with older children sought at least part-time employment. They did so partly out of necessity and partly to pay for the new elements of “the good life”—second cars, vacations, and college education for their children.
The children born during the baby boom were members of a more privileged generation than their parents had been. Entire industries sprang up to cater to their need for clothing, toys, games, books, and breakfast cereals. For the first time in U.S. history, attending high school was an experience shared by the majority, regardless of race or region. As the baby boomers grew into adolescence, marketers realized that they not only controlled large amounts of disposable income earned at part-time jobs, but they exerted a great deal of influence over their parents’ purchases as well. Madison Avenue began to appeal to teenage interests. Boys yearned for cars, and girls of all ethnicities wanted boyfriends who had them. New fashion magazines for adolescent girls, such as Seventeen , advertised the latest clothing and cosmetics, and teen romance magazines, like Copper Romance , a publication for young African American women, filled drugstore racks. The music and movie industries also altered their products to appeal to affluent adolescents who were growing tired of parental constraints.
In 1953, Dwight D. Eisenhower became president of the United States. Fiscally conservative but ideologically moderate, he sought to balance the budget while building a strong system of national defense. This defense policy led to a greater emphasis on the possible use of nuclear weapons in any confrontation with the Soviet Union. Committed to maintaining peace, however, Eisenhower avoided engaging the United States in foreign conflicts; during his presidency, the economy boomed. Young Americans married in record numbers, moved to the growing suburbs, and gave birth to the largest generation to date in U.S. history. As middle-class adults, they conformed to the requirements of corporate jobs and suburban life, while their privileged children enjoyed a consumer culture tailored to their desires.

Notification Switch
Would you like to follow the 'U.s. history' conversation and receive update notifications?