<< Chapter < Page Chapter >> Page >

Employment and migration patterns in the united states

Even before the official beginning of the war, the country started to prepare. In August 1940, Congress created the Defense Plant Corporation, which had built 344 plants in the West by 1945, and had funneled over $1.8 billion into the economies of western states. After Pearl Harbor, as American military strategists began to plan counterattacks and campaigns against the Axis powers, California became a training ground. Troops trained there for tank warfare and amphibious assaults as well as desert campaigns—since the first assault against the Axis powers was planned for North Africa.

As thousands of Americans swarmed to the West Coast to take jobs in defense plants and shipyards, cities like Richmond, California, and nearby Oakland, expanded quickly. Richmond grew from a city of 20,000 people to 100,000 in only three years. Almost overnight, the population of California skyrocketed. African Americans moved out of the rural South into northern or West Coast cities to provide the muscle and skill to build the machines of war. Building on earlier waves of African American migration after the Civil War and during World War I, the demographics of the nation changed with the growing urbanization of the African American population. Women also relocated to either follow their husbands to military bases or take jobs in the defense industry, as the total mobilization of the national economy began to tap into previously underemployed populations.

Roosevelt and his administration already had experience in establishing government controls and taking the initiative in economic matters during the Depression. In April 1941, Roosevelt created the Office of Price Administration (OPA), and, once the United States entered the war, the OPA regulated prices and attempted to combat inflation. The OPA ultimately had the power to set ceiling prices for all goods, except agricultural commodities, and to ration a long list of items. During the war, major labor unions pledged not to strike in order to prevent disruptions in production; in return, the government encouraged businesses to recognize unions and promised to help workers bargain for better wages.

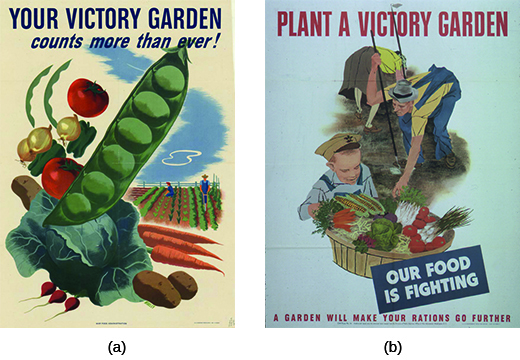
As in World War I, the government turned to bond drives to finance the war. Millions of Americans purchased more than $185 billion worth of war bonds. Children purchased Victory Stamps and exchanged full stamp booklets for bonds. The federal government also instituted the current tax-withholding system to ensure collection of taxes. Finally, the government once again urged Americans to plant victory gardens, using marketing campaigns and celebrities to promote the idea ( [link] ). Americans responded eagerly, planting gardens in their backyards and vacant lots.

Poster (a) reads “Your Victory Garden counts more than ever!” and features a series of bright vegetables in the foreground with a farm scene in the background. Poster (b) reads “Plant a Victory Garden. Our Food is Fighting. A Garden Will Make Your Rations Go Further.” An illustration of a man and a woman tending farm vegetables is shown, with a small boy in the foreground smiling at a large basket of freshly picked vegetables.
Wartime rationing meant that Americans had to do without many everyday items and learn to grow their own produce in order to allow the country’s food supply to go to the troops.

The federal government also instituted rationing to ensure that America’s fighting men were well fed. Civilians were issued ration booklets, books of coupons that enabled them to buy limited amounts of meat, coffee, butter, sugar, and other foods. Wartime cookbooks were produced, such as the Betty Crocker cookbook Your Share , telling housewives how to prepare tasty meals without scarce food items. Other items were rationed as well, including shoes, liquor, cigarettes, and gasoline. With a few exceptions, such as doctors, Americans were allowed to drive their automobiles only on certain days of the week. Most Americans complied with these regulations, but some illegally bought and sold rationed goods on the black market.

Questions & Answers

What are the factors that affect demand for a commodity
Florence Reply
differentiate between demand and supply giving examples
Lambiv Reply
differentiated between demand and supply using examples
Lambiv
what is labour ?
Lambiv
how will I do?
Venny Reply
how is the graph works?I don't fully understand
Rezat Reply
information
Eliyee
devaluation
Eliyee
t
WARKISA
hi guys good evening to all
Lambiv
multiple choice question
Aster Reply
appreciation
Eliyee
explain perfect market
Lindiwe Reply
In economics, a perfect market refers to a theoretical construct where all participants have perfect information, goods are homogenous, there are no barriers to entry or exit, and prices are determined solely by supply and demand. It's an idealized model used for analysis,
Ezea
What is ceteris paribus?
Shukri Reply
other things being equal
AI-Robot
When MP₁ becomes negative, TP start to decline. Extuples Suppose that the short-run production function of certain cut-flower firm is given by: Q=4KL-0.6K2 - 0.112 • Where is quantity of cut flower produced, I is labour input and K is fixed capital input (K-5). Determine the average product of lab
Kelo
Extuples Suppose that the short-run production function of certain cut-flower firm is given by: Q=4KL-0.6K2 - 0.112 • Where is quantity of cut flower produced, I is labour input and K is fixed capital input (K-5). Determine the average product of labour (APL) and marginal product of labour (MPL)
Kelo
yes,thank you
Shukri
Can I ask you other question?
Shukri
what is monopoly mean?
Habtamu Reply
What is different between quantity demand and demand?
Shukri Reply
Quantity demanded refers to the specific amount of a good or service that consumers are willing and able to purchase at a give price and within a specific time period. Demand, on the other hand, is a broader concept that encompasses the entire relationship between price and quantity demanded
Ezea
ok
Shukri
how do you save a country economic situation when it's falling apart
Lilia Reply
what is the difference between economic growth and development
Fiker Reply
Economic growth as an increase in the production and consumption of goods and services within an economy.but Economic development as a broader concept that encompasses not only economic growth but also social & human well being.
Shukri
production function means
Jabir
What do you think is more important to focus on when considering inequality ?
Abdisa Reply
any question about economics?
Awais Reply
sir...I just want to ask one question... Define the term contract curve? if you are free please help me to find this answer 🙏
Asui
it is a curve that we get after connecting the pareto optimal combinations of two consumers after their mutually beneficial trade offs
Awais
thank you so much 👍 sir
Asui
In economics, the contract curve refers to the set of points in an Edgeworth box diagram where both parties involved in a trade cannot be made better off without making one of them worse off. It represents the Pareto efficient allocations of goods between two individuals or entities, where neither p
Cornelius
In economics, the contract curve refers to the set of points in an Edgeworth box diagram where both parties involved in a trade cannot be made better off without making one of them worse off. It represents the Pareto efficient allocations of goods between two individuals or entities,
Cornelius
Suppose a consumer consuming two commodities X and Y has The following utility function u=X0.4 Y0.6. If the price of the X and Y are 2 and 3 respectively and income Constraint is birr 50. A,Calculate quantities of x and y which maximize utility. B,Calculate value of Lagrange multiplier. C,Calculate quantities of X and Y consumed with a given price. D,alculate optimum level of output .
Feyisa Reply
Answer
Feyisa
c
Jabir
the market for lemon has 10 potential consumers, each having an individual demand curve p=101-10Qi, where p is price in dollar's per cup and Qi is the number of cups demanded per week by the i th consumer.Find the market demand curve using algebra. Draw an individual demand curve and the market dema
Gsbwnw Reply
suppose the production function is given by ( L, K)=L¼K¾.assuming capital is fixed find APL and MPL. consider the following short run production function:Q=6L²-0.4L³ a) find the value of L that maximizes output b)find the value of L that maximizes marginal product
Abdureman
Got questions? Join the online conversation and get instant answers!
Jobilize.com Reply

Get Jobilize Job Search Mobile App in your pocket Now!

Get it on Google Play Download on the App Store Now


Source:  OpenStax, U.s. history. OpenStax CNX. Jan 12, 2015 Download for free at http://legacy.cnx.org/content/col11740/1.3
Google Play and the Google Play logo are trademarks of Google Inc.

Notification Switch

Would you like to follow the 'U.s. history' conversation and receive update notifications?

Ask