

| << Chapter < Page | Chapter >> Page > |
Seventeenth-century French and Dutch colonies in North America were modest in comparison to Spain’s colossal global empire. New France and New Netherland remained small commercial operations focused on the fur trade and did not attract an influx of migrants. The Dutch in New Netherland confined their operations to Manhattan Island, Long Island, the Hudson River Valley, and what later became New Jersey. Dutch trade goods circulated widely among the native peoples in these areas and also traveled well into the interior of the continent along preexisting native trade routes. French habitants , or farmer-settlers, eked out an existence along the St. Lawrence River. French fur traders and missionaries, however, ranged far into the interior of North America, exploring the Great Lakes region and the Mississippi River. These pioneers gave France somewhat inflated imperial claims to lands that nonetheless remained firmly under the dominion of native peoples.
The Dutch Republic emerged as a major commercial center in the 1600s. Its fleets plied the waters of the Atlantic, while other Dutch ships sailed to the Far East, returning with prized spices like pepper to be sold in the bustling ports at home, especially Amsterdam. In North America, Dutch traders established themselves first on Manhattan Island.
One of the Dutch directors-general of the North American settlement, Peter Stuyvesant, served from 1647 to 1664 and expanded the fledgling outpost of New Netherland east to present-day Long Island and for many miles north along the Hudson River. The resulting elongated colony served primarily as a fur-trading post, with the powerful Dutch West India Company controlling all commerce. Fort Amsterdam, on the southern tip of Manhattan Island, defended the growing city of New Amsterdam. In 1655, Stuyvesant took over the small outpost of New Sweden along the banks of the Delaware River in present-day New Jersey, Pennsylvania, and Delaware. He also defended New Amsterdam from Indian attacks by ordering African slaves to build a protective wall on the city’s northeastern border, giving present-day Wall Street its name ( [link] ).
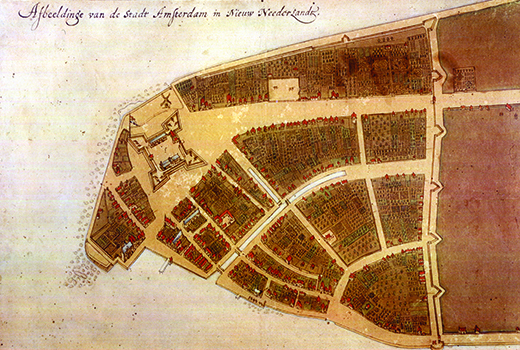
New Netherland failed to attract many Dutch colonists; by 1664, only nine thousand people were living there. Conflict with native peoples, as well as dissatisfaction with the Dutch West India Company’s trading practices, made the Dutch outpost an undesirable place for many migrants. The small size of the population meant a severe labor shortage, and to complete the arduous tasks of early settlement, the Dutch West India Company imported some 450 African slaves between 1626 and 1664. (The company had involved itself heavily in the slave trade and in 1637 captured Elmina, the slave-trading post on the west coast of Africa, from the Portuguese.) The shortage of labor also meant that New Netherland welcomed non-Dutch immigrants, including Protestants from Germany, Sweden, Denmark, and England, and embraced a degree of religious tolerance, allowing Jewish immigrants to become residents beginning in the 1650s. Thus, a wide variety of people lived in New Netherland from the start. Indeed, one observer claimed eighteen different languages could be heard on the streets of New Amsterdam. As new settlers arrived, the colony of New Netherland stretched farther to the north and the west ( [link] ).
Notification Switch
Would you like to follow the 'U.s. history' conversation and receive update notifications?

|
|

|
|

|
|

|
|

|
|

|
|
|
|
|

|
|

|
|

|
|

|