<< Chapter < Page Chapter >> Page >
A line graph titled “Voting Rates Over Time for the Voting-Age Population: 1964-2012”. The x-axis starts in 1964 and marks every 4 years until 2012. The y-axis goes from 30 to 80 percent. The line labeled “18 to 24 years” starts at 50.9% in 1964, drops steadily to around 40% in 1980, increases to around 43% in 1984, decreases to around 37% in 1988, increases to around 44% in 1992, decreases to around 30% in 1996 and stays there through 2000, increases to around 43% in 2004, then around 45% in 2008, then decreases to 38% in 2012. The line labeled “25 to 44 years” starts at 69% in 1964, then drops steadily to around 57% in 1976 and stays there through 1984, decreases to around 55% in 1988, increases to around 58% in 1992, decreases to around 50% in 1996, then increases steadily to around 55% in 2004 and stays there through 2008, then decreases to 49.5% in 2012. The line labeled “45 to 64 years” starts at 75.9% in 1964, decreases steadily to around 68% in 1976 and stays around there until 1992, decreases to around 63% in 1996 and stays there through 2000,, increases to around 68% in 2004, and then decreases steadily to 63.4% in 2012. The line labeled “65 years and older” starts at 66.3% in 1964, decreases steadily to around 63% in 1976, increases steadily to around 69% in 1992, decreases to around 67% in 1996, increases steadily to around 68% in 2004, decreases to around 67% in 2008, and increases to 69.7% in 2012. At the bottom of the graph a source is listed: “U. S. Census Bureau, Current Population Survey, Select Years”.

Making a difference

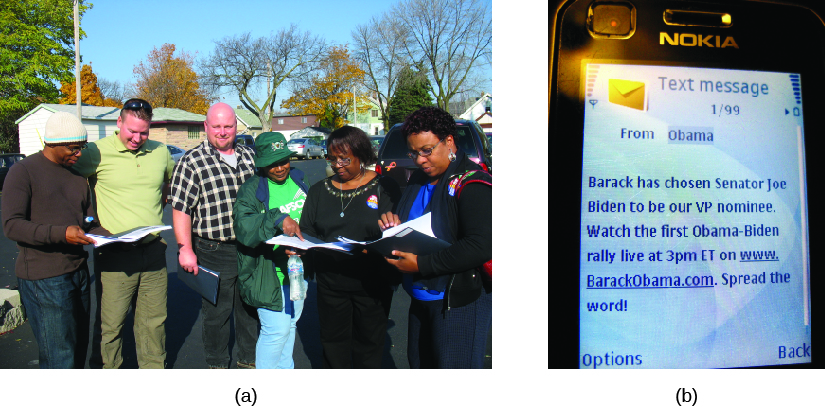
In 2008, for the first time since 1972, a presidential candidate intrigued America’s youth and persuaded them to flock to the polls in record numbers. Barack Obama not only spoke to young people’s concerns but his campaign also connected with them via technology, wielding texts and tweets to bring together a new generation of voters ( [link] ).

Image A is of a group of people standing and holding binders. Image B is a screenshot of a cell phone screen. The screen reads “Text message from Obama. Barack has chosen Senator Joe Biden to be our VP nominee. Watch the first Obama-Biden rally live at 3pm ET on www.BarackObama.com. Spread the word!”
On November 5, 2008, union members get ready to hit the streets in Milwaukee, Wisconsin, to “get out the vote” (GOTV) for Barack Obama (a). On August 23, 2008, the Obama campaign texted supporters directly in order to announce that he had selected Senator Joe Biden (D-DE) as his running mate (b). (credit a: modification of work by Casie Yoder; credit b: modification of work by “brownpau”/Flickr)

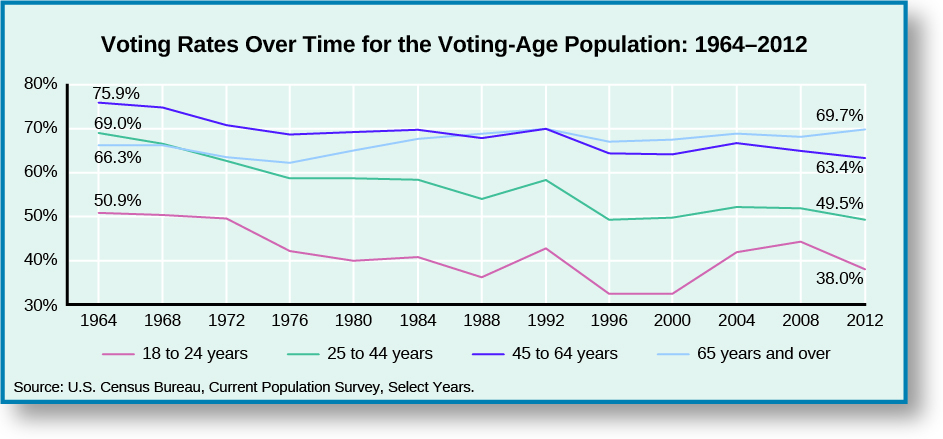
The high level of interest Obama inspired among college-aged voters was a milestone in modern politics. Since the 1971 passage of the Twenty-Sixth Amendment, which lowered the voting age from 21 to 18, voter turnout in the under-25 range has been low. While opposition to the Vietnam War and the military draft sent 50.9 percent of 21- to 24-year-old voters to the polls in 1964, after 1972, turnout in that same age group dropped to below 40 percent as youth became disenchanted with politics. In 2008, however, it briefly increased to 45 percent from only 32 percent in 2000. Yet, despite high interest in Obama’s candidacy in 2008, younger voters were less enchanted in 2012—only 38 percent showed up to vote that year.

Thom File, “Young-Adult Voting: An Analysis of Presidential Elections 1964-2012,” United States Census Bureau , P20-573, April 2014, https://www.census.gov/prod/2014pubs/p20-573.pdf.

What qualities should a presidential or congressional candidate show in order to get college students excited and voting? Why?

A citizen’s socioeconomic status—the combination of education, income, and social status—may also predict whether he or she will vote. Among those who have completed college, the 2012 voter turnout rate jumps to 75 percent of eligible voters, compared to about 52.6 percent for those who have completed only high school.

“Table 5. Reported Voting and Registration, by Age, Sex, and Educational Attainment: November 2012,” https://www.census.gov/hhes/www/socdemo/voting/publications/p20/2012/tables.html (November 6, 2015).
This is due in part to the powerful effect of education, one of the strongest predictors of voting turnout. Income also has a strong effect on the likelihood of voting. Citizens earning $100,000 to $149,999 a year are very likely to vote and 76.9 percent of them do, while only 50.4 percent of those who earn $15,000 to $19,999 vote.
“Table 7. Reported Voting and Registration of Family Members, by Age and Family Income: November 2012,” https://www.census.gov/hhes/www/socdemo/voting/publications/p20/2012/tables.html (November 5, 2015).
Once high income and college education are combined, the resulting high socioeconomic status strongly predicts the likelihood that a citizen will vote.

Race is also a factor. Caucasians turn out to vote in the highest numbers, with 63 percent of white citizens voting in 2012. In comparison, 62 percent of African Americans, 31.3 percent of Asian Americans, and 31.8 percent of Hispanic citizens voted in 2012. Voting turnout can increase or decrease based upon the political culture of a state, however. Hispanics, for example, often vote in higher numbers in states where there has historically been higher Hispanic involvement and representation, such as New Mexico, where 49 percent of Hispanic voters turned out in 2012.

“Table 4b. Reported Voting and Registration, by Sex, Race and Hispanic Origin, for States: November 2012,” https://www.census.gov/hhes/www/socdemo/voting/publications/p20/2012/tables.html (November 2, 2015).
In 2016, while Donald Trump rode a wave of discontent among white voters to the presidency, the fact that Hillary Clinton nearly beat him has much to do with the record turnout of Latinos in response to numerous remarks on immigration that Trump made throughout his campaign. Record Latino turnouts were seen in many states, including California, Arizona, Nevada, Florida, and North Carolina.
Steven Shepard. 6 November 2016. “Latino voting surge rattles Trump campaign,” http://www.politico.com/story/2016/11/latino-vote-surge-donald-trump-campaign-230804 (November 9, 2016).

Questions & Answers

how does Neisseria cause meningitis
Nyibol Reply
what is microbiologist
Muhammad Reply
what is errata
Muhammad
is the branch of biology that deals with the study of microorganisms.
Ntefuni Reply
What is microbiology
Mercy Reply
studies of microbes
Louisiaste
when we takee the specimen which lumbar,spin,
Ziyad Reply
How bacteria create energy to survive?
Muhamad Reply
Bacteria doesn't produce energy they are dependent upon their substrate in case of lack of nutrients they are able to make spores which helps them to sustain in harsh environments
_Adnan
But not all bacteria make spores, l mean Eukaryotic cells have Mitochondria which acts as powerhouse for them, since bacteria don't have it, what is the substitution for it?
Muhamad
they make spores
Louisiaste
what is sporadic nd endemic, epidemic
Aminu Reply
the significance of food webs for disease transmission
Abreham
food webs brings about an infection as an individual depends on number of diseased foods or carriers dully.
Mark
explain assimilatory nitrate reduction
Esinniobiwa Reply
Assimilatory nitrate reduction is a process that occurs in some microorganisms, such as bacteria and archaea, in which nitrate (NO3-) is reduced to nitrite (NO2-), and then further reduced to ammonia (NH3).
Elkana
This process is called assimilatory nitrate reduction because the nitrogen that is produced is incorporated in the cells of microorganisms where it can be used in the synthesis of amino acids and other nitrogen products
Elkana
Examples of thermophilic organisms
Shu Reply
Give Examples of thermophilic organisms
Shu
advantages of normal Flora to the host
Micheal Reply
Prevent foreign microbes to the host
Abubakar
they provide healthier benefits to their hosts
ayesha
They are friends to host only when Host immune system is strong and become enemies when the host immune system is weakened . very bad relationship!
Mark
what is cell
faisal Reply
cell is the smallest unit of life
Fauziya
cell is the smallest unit of life
Akanni
ok
Innocent
cell is the structural and functional unit of life
Hasan
is the fundamental units of Life
Musa
what are emergency diseases
Micheal Reply
There are nothing like emergency disease but there are some common medical emergency which can occur simultaneously like Bleeding,heart attack,Breathing difficulties,severe pain heart stock.Hope you will get my point .Have a nice day ❣️
_Adnan
define infection ,prevention and control
Innocent
I think infection prevention and control is the avoidance of all things we do that gives out break of infections and promotion of health practices that promote life
Lubega
Heyy Lubega hussein where are u from?
_Adnan
en français
Adama
which site have a normal flora
ESTHER Reply
Many sites of the body have it Skin Nasal cavity Oral cavity Gastro intestinal tract
Safaa
skin
Asiina
skin,Oral,Nasal,GIt
Sadik
How can Commensal can Bacteria change into pathogen?
Sadik
How can Commensal Bacteria change into pathogen?
Sadik
all
Tesfaye
by fussion
Asiina
what are the advantages of normal Flora to the host
Micheal
what are the ways of control and prevention of nosocomial infection in the hospital
Micheal
what is inflammation
Shelly Reply
part of a tissue or an organ being wounded or bruised.
Wilfred
what term is used to name and classify microorganisms?
Micheal Reply
Binomial nomenclature
adeolu
Got questions? Join the online conversation and get instant answers!
Jobilize.com Reply

Get Jobilize Job Search Mobile App in your pocket Now!

Get it on Google Play Download on the App Store Now


Source:  OpenStax, American government. OpenStax CNX. Dec 05, 2016 Download for free at http://cnx.org/content/col11995/1.15
Google Play and the Google Play logo are trademarks of Google Inc.

Notification Switch

Would you like to follow the 'American government' conversation and receive update notifications?

Ask