

| << Chapter < Page | Chapter >> Page > |
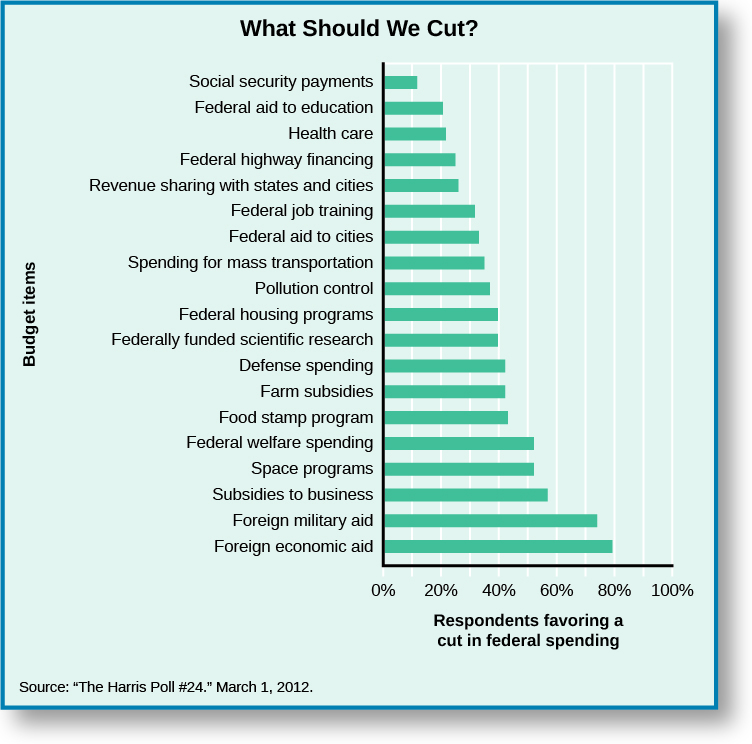
In general, programs that benefit only some Americans or have unclear benefits cause more controversy and discussion when the economy slows. Few citizens directly benefit from welfare and business subsidies, so it is not surprising that 52 percent of respondents wanted to cut back on welfare and 57 percent wanted to cut back business subsidies. While some farm subsidies decrease the price of food items, like milk and corn, citizens may not be aware of how these subsidies affect the price of goods at the grocery store, perhaps explaining why 44 percent of respondents stated they would prefer to cut back on agricultural subsidies.
Harris Poll Online. 2012. “Cutting Government Spending May be Popular But Majorities of the Public Oppose Cuts in Many Big Ticket Items in the Budget.”
Harris Poll Online . March 1, 2012. http://www.harrisinteractive.com/NewsRoom/HarrisPolls/tabid/447/mid/1508/articleId/972/ctl/ReadCustom percent20Default/Default.aspx (February 18, 2016); Frank Newport, and Lydia Saad, 2011. “Americans Oppose Cuts in Education, Social Security, Defense.”
Gallup . January 2, 2011. http://www.gallup.com/poll/145790/Americans-Oppose-Cuts-Education-Social-Security-Defense.aspx (February 18, 2016).
Social policy consists of government’s attempts to regulate public behavior in the service of a better society. To accomplish this, government must achieve the difficult task of balancing the rights and liberties of citizens. A person’s right to privacy, for example, might need to be limited if another person is in danger. But to what extent should the government intrude in the private lives of its citizens? In a recent survey, 54 percent of respondents believed the U.S. government was too involved in trying to deal with issues of morality.
Pew Research Center. 2011. “Domestic Issues and Social Policy.”
Pew Research Center . May 4, 2011. http://www.people-press.org/2011/05/04/section-8-domestic-issues-and-social-policy/ (February 18, 2016).
Abortion is a social policy issue that has caused controversy for nearly a century. One segment of the population wants to protect the rights of the unborn child. Another wants to protect the bodily autonomy of women and the right to privacy between a patient and her doctor. The divide is visible in public opinion polls, where 51 percent of respondents said abortion should be legal in most cases and 43 percent said it should be illegal in most cases. The
Affordable Care Act , which increased government involvement in health care, has drawn similar controversy. In a 2015 poll, 53 percent of respondents disapproved of the act, a 9-percent increase from five years before. Much of the public’s frustration comes from the act’s mandate that individuals purchase health insurance or pay a fine (in order to create a large enough pool of insured people to reduce the overall cost of coverage), which some see as an intrusion into individual decision making.
Pew Research Center. 2015. “Views of Health Care Law, 2010-2015.”
Pew Research Center . March 3, 2015. http://www.pewresearch.org/fact-tank/2015/03/04/opinions-on-obamacare-remain-divided-along-party-lines-as-supreme-court-hears-new-challenge/ft_acaapprove (February 18, 2016).
Notification Switch
Would you like to follow the 'American government' conversation and receive update notifications?

|
|

|
|

|
|

|
|

|
|
|
|
|
|
|
|

|
|

|
|

|