<< Chapter < Page Chapter >> Page >

Finally, the right-hand portion of the long-run average cost curve, running from output level Q 4 to Q 5 , shows a situation where, as the level of output and the scale rises, average costs rise as well. This situation is called diseconomies of scale    . A firm or a factory can grow so large that it becomes very difficult to manage, resulting in unnecessarily high costs as many layers of management try to communicate with workers and with each other, and as failures to communicate lead to disruptions in the flow of work and materials. Not many overly large factories exist in the real world, because with their very high production costs, they are unable to compete for long against plants with lower average costs of production. However, in some planned economies, like the economy of the old Soviet Union, plants that were so large as to be grossly inefficient were able to continue operating for a long time because government economic planners protected them from competition and ensured that they would not make losses.

Diseconomies of scale can also be present across an entire firm, not just a large factory. The leviathan effect can hit firms that become too large to run efficiently, across the entirety of the enterprise. Firms that shrink their operations are often responding to finding itself in the diseconomies region, thus moving back to a lower average cost at a lower output level.

Visit this website to read an article about the complexity of the belief that banks can be “too-big-to-fail.”

The size and number of firms in an industry

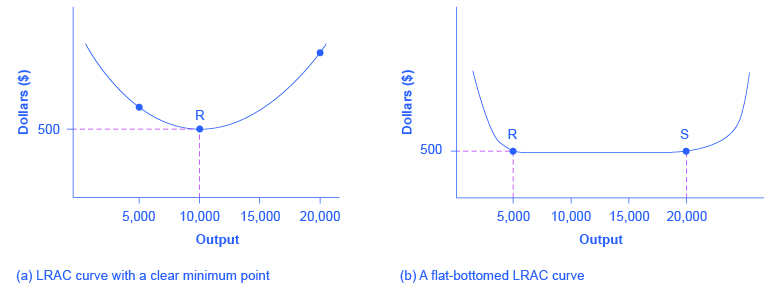
The shape of the long-run average cost curve has implications for how many firms will compete in an industry, and whether the firms in an industry have many different sizes, or tend to be the same size. For example, say that one million dishwashers are sold every year at a price of $500 each and the long-run average cost curve for dishwashers is shown in [link] (a). In [link] (a), the lowest point of the LRAC curve occurs at a quantity of 10,000 produced. Thus, the market for dishwashers will consist of 100 different manufacturing plants of this same size. If some firms built a plant that produced 5,000 dishwashers per year or 25,000 dishwashers per year, the average costs of production at such plants would be well above $500, and the firms would not be able to compete.

The lrac curve and the size and number of firms

The two graphs show how the LRAC is affected by competition between firms.
(a) Low-cost firms will produce at output level R. When the LRAC curve has a clear minimum point, then any firm producing a different quantity will have higher costs. In this case, a firm producing at a quantity of 10,000 will produce at a lower average cost than a firm producing, say, 5,000 or 20,000 units. (b) Low-cost firms will produce between output levels R and S. When the LRAC curve has a flat bottom, then firms producing at any quantity along this flat bottom can compete. In this case, any firm producing a quantity between 5,000 and 20,000 can compete effectively, although firms producing less than 5,000 or more than 20,000 would face higher average costs and be unable to compete.

Questions & Answers

what does mean opportunity cost?
Aster Reply
what is poetive effect of population growth
Solomon Reply
what is inflation
Nasir Reply
what is demand
Eleni
what is economics
IMLAN Reply
economics theory describes individual behavior as the result of a process of optimization under constraints the objective to be reached being determined by
Kalkidan
Economics is a branch of social science that deal with How to wise use of resource ,s
Kassie
need
WARKISA
Economic Needs: In economics, needs are goods or services that are necessary for maintaining a certain standard of living. This includes things like healthcare, education, and transportation.
Kalkidan
What is demand and supply
EMPEROR Reply
deman means?
Alex
what is supply?
Alex
ex play supply?
Alex
Money market is a branch or segment of financial market where short-term debt instruments are traded upon. The instruments in this market includes Treasury bills, Bonds, Commercial Papers, Call money among other.
murana Reply
good
Kayode
what is money market
umar Reply
Examine the distinction between theory of comparative cost Advantage and theory of factor proportion
Fatima Reply
What is inflation
Bright Reply
a general and ongoing rise in the level of prices in an economy
AI-Robot
What are the factors that affect demand for a commodity
Florence Reply
price
Kenu
differentiate between demand and supply giving examples
Lambiv Reply
differentiated between demand and supply using examples
Lambiv
what is labour ?
Lambiv
how will I do?
Venny Reply
how is the graph works?I don't fully understand
Rezat Reply
information
Eliyee
devaluation
Eliyee
t
WARKISA
hi guys good evening to all
Lambiv
multiple choice question
Aster Reply
appreciation
Eliyee
explain perfect market
Lindiwe Reply
In economics, a perfect market refers to a theoretical construct where all participants have perfect information, goods are homogenous, there are no barriers to entry or exit, and prices are determined solely by supply and demand. It's an idealized model used for analysis,
Ezea

Get Jobilize Job Search Mobile App in your pocket Now!

Get it on Google Play Download on the App Store Now


Source:  OpenStax, Principles of economics. OpenStax CNX. Sep 19, 2014 Download for free at http://legacy.cnx.org/content/col11613/1.11
Google Play and the Google Play logo are trademarks of Google Inc.

Notification Switch

Would you like to follow the 'Principles of economics' conversation and receive update notifications?

Ask