<< Chapter < Page Chapter >> Page >

The long-run adjustment and industry types

Whenever there are expansions in an industry, costs of production for the existing and new firms could either stay the same, increase, or even decrease. Therefore, we can categorize an industry as being (1) a constant cost industry (as demand increases, the cost of production for firms stays the same), (2) an increasing cost industry (as demand increases, the cost of production for firms increases), or (3) a decreasing cost industry (as demand increases the costs of production for the firms decreases).

For a constant cost industry , whenever there is an increase in market demand and price, then the supply curve shifts to the right with new firms’ entry and stops at the point where the new long-run equilibrium intersects at the same market price as before. But why will costs remain the same? In this type of industry, the supply curve is very elastic. Firms can easily supply any quantity that consumers demand. In addition, there is a perfectly elastic supply of inputs—firms can easily increase their demand for employees, for example, with no increase to wages. Tying in to our Bring it Home discussion, an increased demand for ethanol in recent years has caused the demand for corn to increase. Consequently, many farmers switched from growing wheat to growing corn. Agricultural markets are generally good examples of constant cost industries.

For an increasing cost industry , as the market expands, the old and new firms experience increases in their costs of production, which makes the new zero-profit level intersect at a higher price than before. Here companies may have to deal with limited inputs, such as skilled labor. As the demand for these workers rise, wages rise and this increases the cost of production for all firms. The industry supply curve in this type of industry is more inelastic.

For a decreasing cost industry , as the market expands, the old and new firms experience lower costs of production, which makes the new zero-profit level intersect at a lower price than before. In this case, the industry and all the firms in it are experiencing falling average total costs. This can be due to an improvement in technology in the entire industry or an increase in the education of employees. High tech industries may be a good example of a decreasing cost market.

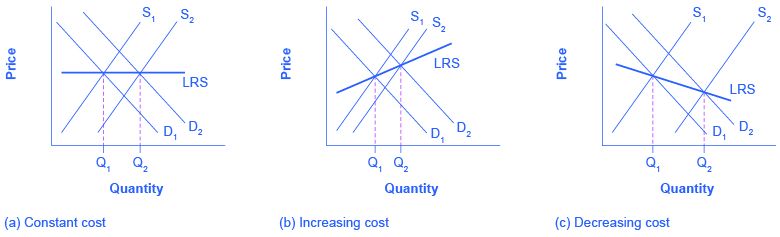
[link] (a) presents the case of an adjustment process in a constant cost industry. Whenever there are output expansions in this type of industry, the long-run outcome implies more output produced at exactly the same original price. Note that supply was able to increase to meet the increased demand. When we join the before and after long-run equilibriums, the resulting line is the long run supply (LRS) curve in perfectly competitive markets. In this case, it is a flat curve. [link] (b) and [link] (c) present the cases for an increasing cost and decreasing cost industry, respectively. For an increasing cost industry, the LRS is upward sloping, while for a decreasing cost industry, the LRS is downward sloping.

Adjustment process in a constant-cost industry

These three graphs show that the LRS is constant when costs do not increase or decrease, LRS slopes upward when costs are increasing, and LRS slopes downward when costs are decreasing.
In (a), demand increased and supply met it. Notice that the supply increase is equal to the demand increase. The result is that the equilibrium price stays the same as quantity sold increases. In (b), notice that sellers were not able to increase supply as much as demand. Some inputs were scarce, or wages were rising. The equilibrium price rises. In (c), sellers easily increased supply in response to the demand increase. Here, new technology or economies of scale caused the large increase in supply, resulting in declining equilibrium price.

Key concepts and summary

In the long run, firms will respond to profits through a process of entry, where existing firms expand output and new firms enter the market. Conversely, firms will react to losses in the long run through a process of exit, in which existing firms reduce output or cease production altogether. Through the process of entry in response to profits and exit in response to losses, the price level in a perfectly competitive market will move toward the zero-profit point, where the marginal cost curve crosses the AC curve, at the minimum of the average cost curve.

The long-run supply curve shows the long-run output supplied by firms in three different types of industries: constant cost, increasing cost, and decreasing cost.

Questions & Answers

differentiate between demand and supply giving examples
Lambiv Reply
differentiated between demand and supply using examples
Lambiv
what is labour ?
Lambiv
how will I do?
Venny Reply
how is the graph works?I don't fully understand
Rezat Reply
information
Eliyee
devaluation
Eliyee
t
WARKISA
hi guys good evening to all
Lambiv
multiple choice question
Aster Reply
appreciation
Eliyee
explain perfect market
Lindiwe Reply
In economics, a perfect market refers to a theoretical construct where all participants have perfect information, goods are homogenous, there are no barriers to entry or exit, and prices are determined solely by supply and demand. It's an idealized model used for analysis,
Ezea
What is ceteris paribus?
Shukri Reply
other things being equal
AI-Robot
When MP₁ becomes negative, TP start to decline. Extuples Suppose that the short-run production function of certain cut-flower firm is given by: Q=4KL-0.6K2 - 0.112 • Where is quantity of cut flower produced, I is labour input and K is fixed capital input (K-5). Determine the average product of lab
Kelo
Extuples Suppose that the short-run production function of certain cut-flower firm is given by: Q=4KL-0.6K2 - 0.112 • Where is quantity of cut flower produced, I is labour input and K is fixed capital input (K-5). Determine the average product of labour (APL) and marginal product of labour (MPL)
Kelo
yes,thank you
Shukri
Can I ask you other question?
Shukri
what is monopoly mean?
Habtamu Reply
What is different between quantity demand and demand?
Shukri Reply
Quantity demanded refers to the specific amount of a good or service that consumers are willing and able to purchase at a give price and within a specific time period. Demand, on the other hand, is a broader concept that encompasses the entire relationship between price and quantity demanded
Ezea
ok
Shukri
how do you save a country economic situation when it's falling apart
Lilia Reply
what is the difference between economic growth and development
Fiker Reply
Economic growth as an increase in the production and consumption of goods and services within an economy.but Economic development as a broader concept that encompasses not only economic growth but also social & human well being.
Shukri
production function means
Jabir
What do you think is more important to focus on when considering inequality ?
Abdisa Reply
any question about economics?
Awais Reply
sir...I just want to ask one question... Define the term contract curve? if you are free please help me to find this answer 🙏
Asui
it is a curve that we get after connecting the pareto optimal combinations of two consumers after their mutually beneficial trade offs
Awais
thank you so much 👍 sir
Asui
In economics, the contract curve refers to the set of points in an Edgeworth box diagram where both parties involved in a trade cannot be made better off without making one of them worse off. It represents the Pareto efficient allocations of goods between two individuals or entities, where neither p
Cornelius
In economics, the contract curve refers to the set of points in an Edgeworth box diagram where both parties involved in a trade cannot be made better off without making one of them worse off. It represents the Pareto efficient allocations of goods between two individuals or entities,
Cornelius
Suppose a consumer consuming two commodities X and Y has The following utility function u=X0.4 Y0.6. If the price of the X and Y are 2 and 3 respectively and income Constraint is birr 50. A,Calculate quantities of x and y which maximize utility. B,Calculate value of Lagrange multiplier. C,Calculate quantities of X and Y consumed with a given price. D,alculate optimum level of output .
Feyisa Reply
Answer
Feyisa
c
Jabir
the market for lemon has 10 potential consumers, each having an individual demand curve p=101-10Qi, where p is price in dollar's per cup and Qi is the number of cups demanded per week by the i th consumer.Find the market demand curve using algebra. Draw an individual demand curve and the market dema
Gsbwnw Reply
suppose the production function is given by ( L, K)=L¼K¾.assuming capital is fixed find APL and MPL. consider the following short run production function:Q=6L²-0.4L³ a) find the value of L that maximizes output b)find the value of L that maximizes marginal product
Abdureman
types of unemployment
Yomi Reply
What is the difference between perfect competition and monopolistic competition?
Mohammed

Get Jobilize Job Search Mobile App in your pocket Now!

Get it on Google Play Download on the App Store Now


Source:  OpenStax, Principles of economics. OpenStax CNX. Sep 19, 2014 Download for free at http://legacy.cnx.org/content/col11613/1.11
Google Play and the Google Play logo are trademarks of Google Inc.

Notification Switch

Would you like to follow the 'Principles of economics' conversation and receive update notifications?

Ask