<< Chapter < Page Chapter >> Page >

Technology and wage inequality: the four-step process

Economic events can change the equilibrium salary (or wage) and quantity of labor. Consider how the wave of new information technologies, like computer and telecommunications networks, has affected low-skill and high-skill workers in the U.S. economy. From the perspective of employers who demand labor, these new technologies are often a substitute for low-skill laborers like file clerks who used to keep file cabinets full of paper records of transactions. However, the same new technologies are a complement to high-skill workers like managers, who benefit from the technological advances by being able to monitor more information, communicate more easily, and juggle a wider array of responsibilities. So, how will the new technologies affect the wages of high-skill and low-skill workers? For this question, the four-step process of analyzing how shifts in supply or demand affect a market (introduced in Demand and Supply ) works in this way:

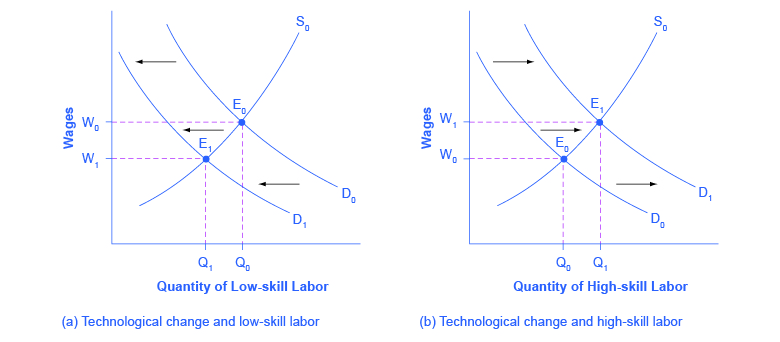
Step 1. What did the markets for low-skill labor and high-skill labor look like before the arrival of the new technologies? In [link] (a) and [link] (b), S 0 is the original supply curve for labor and D 0 is the original demand curve for labor in each market. In each graph, the original point of equilibrium, E 0 , occurs at the price W 0 and the quantity Q 0 .

Technology and wages: applying demand and supply

The two graphs show how new technology influences supply and demand. The graph on the left represents low-skill labor, and the graph on the right represents high-skill labor.
(a) The demand for low-skill labor shifts to the left when technology can do the job previously done by these workers. (b) New technologies can also increase the demand for high-skill labor in fields such as information technology and network administration.

Step 2. Does the new technology affect the supply of labor from households or the demand for labor from firms? The technology change described here affects demand for labor by firms that hire workers.

Step 3. Will the new technology increase or decrease demand? Based on the description earlier, as the substitute for low-skill labor becomes available, demand for low-skill labor will shift to the left, from D 0 to D 1 . As the technology complement for high-skill labor becomes cheaper, demand for high-skill labor will shift to the right, from D 0 to D 1 .

Step 4. The new equilibrium for low-skill labor, shown as point E 1 with price W 1 and quantity Q 1 , has a lower wage and quantity hired than the original equilibrium, E 0 . The new equilibrium for high-skill labor, shown as point E 1 with price W 1 and quantity Q 1 , has a higher wage and quantity hired than the original equilibrium (E 0 ).

So, the demand and supply model predicts that the new computer and communications technologies will raise the pay of high-skill workers but reduce the pay of low-skill workers. Indeed, from the 1970s to the mid-2000s, the wage gap widened between high-skill and low-skill labor. According to the National Center for Education Statistics, in 1980, for example, a college graduate earned about 30% more than a high school graduate with comparable job experience, but by 2012, a college graduate earned about 60% more than an otherwise comparable high school graduate. Many economists believe that the trend toward greater wage inequality across the U.S. economy was primarily caused by the new technologies.

Questions & Answers

how do you get the 2/50
Abba Reply
number of sport play by 50 student construct discrete data
Aminu Reply
width of the frangebany leaves on how to write a introduction
Theresa Reply
Solve the mean of variance
Veronica Reply
Step 1: Find the mean. To find the mean, add up all the scores, then divide them by the number of scores. ... Step 2: Find each score's deviation from the mean. ... Step 3: Square each deviation from the mean. ... Step 4: Find the sum of squares. ... Step 5: Divide the sum of squares by n – 1 or N.
kenneth
what is error
Yakuba Reply
Is mistake done to something
Vutshila
Hy
anas
hy
What is the life teble
anas
hy
Jibrin
statistics is the analyzing of data
Tajudeen Reply
what is statics?
Zelalem Reply
how do you calculate mean
Gloria Reply
diveving the sum if all values
Shaynaynay
let A1,A2 and A3 events be independent,show that (A1)^c, (A2)^c and (A3)^c are independent?
Fisaye Reply
what is statistics
Akhisani Reply
data collected all over the world
Shaynaynay
construct a less than and more than table
Imad Reply
The sample of 16 students is taken. The average age in the sample was 22 years with astandard deviation of 6 years. Construct a 95% confidence interval for the age of the population.
Aschalew Reply
Bhartdarshan' is an internet-based travel agency wherein customer can see videos of the cities they plant to visit. The number of hits daily is a normally distributed random variable with a mean of 10,000 and a standard deviation of 2,400 a. what is the probability of getting more than 12,000 hits? b. what is the probability of getting fewer than 9,000 hits?
Akshay Reply
Bhartdarshan'is an internet-based travel agency wherein customer can see videos of the cities they plan to visit. The number of hits daily is a normally distributed random variable with a mean of 10,000 and a standard deviation of 2,400. a. What is the probability of getting more than 12,000 hits
Akshay
1
Bright
Sorry i want to learn more about this question
Bright
Someone help
Bright
a= 0.20233 b=0.3384
Sufiyan
a
Shaynaynay
How do I interpret level of significance?
Mohd Reply
It depends on your business problem or in Machine Learning you could use ROC- AUC cruve to decide the threshold value
Shivam
how skewness and kurtosis are used in statistics
Owen Reply
yes what is it
Taneeya
Got questions? Join the online conversation and get instant answers!
Jobilize.com Reply

Get Jobilize Job Search Mobile App in your pocket Now!

Get it on Google Play Download on the App Store Now


Source:  OpenStax, Principles of economics. OpenStax CNX. Sep 19, 2014 Download for free at http://legacy.cnx.org/content/col11613/1.11
Google Play and the Google Play logo are trademarks of Google Inc.

Notification Switch

Would you like to follow the 'Principles of economics' conversation and receive update notifications?

Ask