

| << Chapter < Page | Chapter >> Page > |
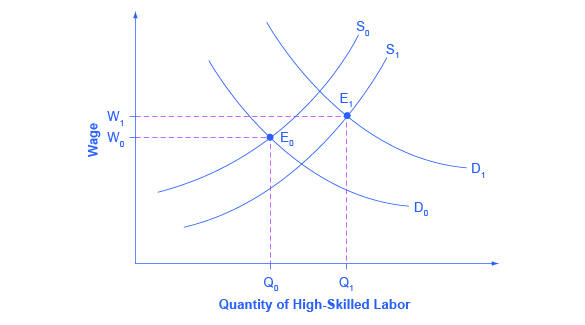
What factors would cause the demand for high-skilled labor to rise? The most plausible explanation is that while the explosion in new information and communications technologies over the last several decades has helped many workers to become more productive, the benefits have been especially great for high-skilled workers like top business managers, consultants, and design professionals. The new technologies have also helped to encourage globalization , the remarkable increase in international trade over the last few decades, by making it more possible to learn about and coordinate economic interactions all around the world. In turn, the rising impact of foreign trade in the U.S. economy has opened up greater opportunities for high-skilled workers to sell their services around the world. And lower-skilled workers have to compete with a larger supply of similarly skilled workers around the globe.
The market for high-skilled labor can be viewed as a race between forces of supply and demand. Additional education and on-the-job training will tend to increase the supply of high-skilled labor and to hold down its relative wage. Conversely, new technology and other economic trends like globalization tend to increase the demand for high-skilled labor and push up its relative wage. The greater inequality of wages can be viewed as a sign that demand for skilled labor is increasing faster than supply. On the other hand, if the supply of lower skilled workers exceeds the demand, then average wages in the lower quintiles of the income distribution will decrease. The combination of forces in the high-skilled and low-skilled labor markets leads to increased income disparity.
Measuring inequality involves making comparisons across the entire distribution of income, not just the poor. One way of doing this is to divide the population into groups, like quintiles, and then calculate what share of income is received by each group. An alternative approach is to draw Lorenz curves, which compare the cumulative income actually received to a perfectly equal distribution of income. Income inequality in the United States increased substantially from the late 1970s and early 1980s into the 2000s. The two most common explanations cited by economists are changes in the structure of households that have led to more two-earner couples and single-parent families, and the effect of new information and communications technology on wages.
A group of 10 people have the following annual incomes: $55,000, $30,000, $15,000, $20,000, $35,000, $80,000, $40,000, $45,000, $30,000, $50,000. Calculate the share of total income received by each quintile of this income distribution. Do the top and bottom quintiles in this distribution have a greater or larger share of total income than the top and bottom quintiles of the U.S. income distribution for 2005?
Frank, Robert H., and Philip J. Cook. The Winner-Take-All Society . New York: Martin Kessler Books at The Free Press, 1995.
Institute of Education Sciences: National Center for Education Statistics. “Fast Facts: Degrees Conferred by Sex and Race.” http://nces.ed.gov/fastfacts/display.asp?id=72.
Nhan, Doris. “Census: More in U.S. Report Nontraditional Households.” National Journal . Last modified May 1, 2012. http://www.nationaljournal.com/thenextamerica/demographics/census-more-in-u-s-report-nontraditional-households-20120430.
U.S. Bureau of Labor Statistics: BLS Reports. “Report 1040: Women in the Labor Force: A Databook.” Last modified March 26, 2013. http://www.bls.gov/cps/wlf-databook-2012.pdf.
U.S. Department of Commerce: United States Census Bureau. “Income: Table H-2. Share of Aggregate Income Received by Each Fifth and Top 5 Percent of Households.” http://www.census.gov/hhes/www/income/data/historical/household/.
United States Census Bureau. 2014. “2013 Highlights.” Accessed April 13, 2015. http://www.census.gov/hhes/www/poverty/about/overview/.
United States Census Bureau. 2014. “Historical Income Tables: Households: Table H-2 Share of Aggregate Income Received by Each Fifth and Top 5% of Income. All Races.” Accessed April 13, 2015. http://www.census.gov/hhes/www/income/data/historical/household/.
Notification Switch
Would you like to follow the 'Principles of economics' conversation and receive update notifications?

|
|

|
|

|
|

|
|

|
|

|
|

|
|

|
|

|
|

|
|

|