<< Chapter < Page Chapter >> Page >

Signs of a recession

The image shows a “Foreclosure” sign in the foreground and the tops of a couple of houses in the background.
Home foreclosures were just one of the many signs and symptoms of the recent Great Recession. During that time, many businesses closed and many people lost their jobs. (Credit: modification of work by Taber Andrew Bain/Flickr Creative Commons)

The great recession

The Great Recession of 2008–2009 hit the U.S. economy hard. According to the Bureau of Labor Statistics (BLS), the number of unemployed Americans rose from 6.8 million in May 2007 to 15.4 million in October 2009. During that time, the U.S. Census Bureau estimated that approximately 170,000 small businesses closed. Mass layoffs peaked in February 2009 when 326,392 workers were given notice. U.S. productivity and output fell as well. Job losses, declining home values, declining incomes, and uncertainty about the future caused consumption expenditures to decrease. According to the BLS, household spending dropped by 7.8%.

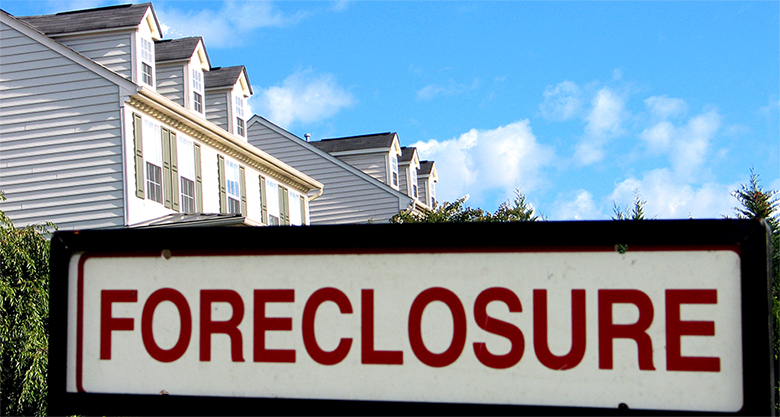
Home foreclosures and the meltdown in U.S. financial markets called for immediate action by Congress, the President, and the Federal Reserve Bank. For example, programs such as the American Restoration and Recovery Act were implemented to help millions of people by providing tax credits for homebuyers, paying “cash for clunkers,” and extending unemployment benefits. From cutting back on spending, filing for unemployment, and losing homes, millions of people were affected by the recession. And while the United States is now on the path to recovery, the impact will be felt for many years to come.

What caused this recession and what prevented the economy from spiraling further into another depression? Policymakers looked to the lessons learned from the Great Depression of the 1930s and to the models developed by John Maynard Keynes to analyze the causes and find solutions to the country’s economic woes. The Keynesian perspective is the subject of this chapter.

Introduction to the keynesian perspective

In this chapter, you will learn about:

  • Aggregate Demand in Keynesian Analysis
  • The Building Blocks of Keynesian Analysis
  • The Phillips Curve
  • The Keynesian Perspective on Market Forces

We have learned that the level of economic activity, for example output, employment, and spending, tends to grow over time. In The Keynesian Perspective we learned the reasons for this trend. The Macroeconomic Perspective pointed out that the economy tends to cycle around the long-run trend. In other words, the economy does not always grow at its average growth rate. Sometimes economic activity grows at the trend rate, sometimes it grows more than the trend, sometimes it grows less than the trend, and sometimes it actually declines. You can see this cyclical behavior in [link] .

U.s. gross domestic product, percent changes 1930–2014

The line graph shows how GDP percentages have fluctuated since 1930 with the highest percentage in the early 1940s and the lowest percentage in the early 1930s (closely followed by the mid 1940s).
The chart tracks the percent change in GDP since 1930. The magnitude of both recessions and peaks was quite large between 1930 and 1945. (Source: Bureau of Economic Analysis, “National Economic Accounts”)

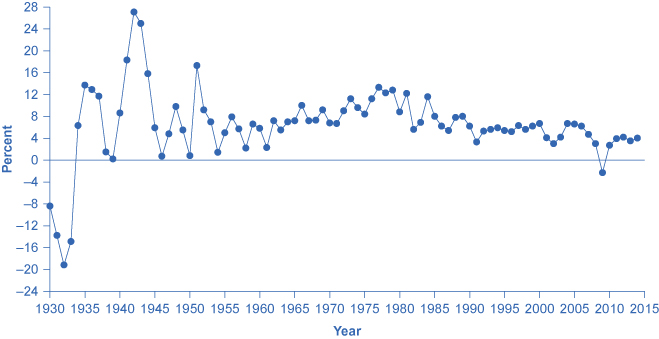
This empirical reality raises two important questions: How can we explain the cycles, and to what extent can they be moderated? This chapter (on the Keynesian perspective) and The Neoclassical Perspective explore those questions from two different points of view, building on what we learned in The Aggregate Demand/Aggregate Supply Model .

Questions & Answers

Why is b in the answer
Dahsolar Reply
how do you work it out?
Brad Reply
answer
Ernest
heheheehe
Nitin
(Pcos∅+qsin∅)/(pcos∅-psin∅)
John Reply
how to do that?
Rosemary Reply
what is it about?
Amoah
how to answer the activity
Chabelita Reply
how to solve the activity
Chabelita
solve for X,,4^X-6(2^)-16=0
Alieu Reply
x4xminus 2
Lominate
sobhan Singh jina uniwarcity tignomatry ka long answers tile questions
harish Reply
t he silly nut company makes two mixtures of nuts: mixture a and mixture b. a pound of mixture a contains 12 oz of peanuts, 3 oz of almonds and 1 oz of cashews and sells for $4. a pound of mixture b contains 12 oz of peanuts, 2 oz of almonds and 2 oz of cashews and sells for $5. the company has 1080
ZAHRO Reply
If  , , are the roots of the equation 3 2 0, x px qx r     Find the value of 1  .
Swetha Reply
Parts of a pole were painted red, blue and yellow. 3/5 of the pole was red and 7/8 was painted blue. What part was painted yellow?
Patrick Reply
Parts of the pole was painted red, blue and yellow. 3 /5 of the pole was red and 7 /8 was painted blue. What part was painted yellow?
Patrick
how I can simplify algebraic expressions
Katleho Reply
Lairene and Mae are joking that their combined ages equal Sam’s age. If Lairene is twice Mae’s age and Sam is 69 yrs old, what are Lairene’s and Mae’s ages?
Mary Reply
23yrs
Yeboah
lairenea's age is 23yrs
ACKA
hy
Katleho
Ello everyone
Katleho
Laurene is 46 yrs and Mae is 23 is
Solomon
hey people
christopher
age does not matter
christopher
solve for X, 4^x-6(2*)-16=0
Alieu
prove`x^3-3x-2cosA=0 (-π<A<=π
Mayank Reply
create a lesson plan about this lesson
Rose Reply
Excusme but what are you wrot?
Got questions? Join the online conversation and get instant answers!
Jobilize.com Reply

Get Jobilize Job Search Mobile App in your pocket Now!

Get it on Google Play Download on the App Store Now


Source:  OpenStax, Principles of economics. OpenStax CNX. Sep 19, 2014 Download for free at http://legacy.cnx.org/content/col11613/1.11
Google Play and the Google Play logo are trademarks of Google Inc.

Notification Switch

Would you like to follow the 'Principles of economics' conversation and receive update notifications?

Ask