<< Chapter < Page Chapter >> Page >
In this chapter, you will learn about:
  • Macroeconomic Perspectives on Demand and Supply
  • Building a Model of Aggregate Demand and Aggregate Supply
  • Shifts in Aggregate Supply
  • Shifts in Aggregate Demand
  • How the AD/AS Model Incorporates Growth, Unemployment, and Inflation
  • Keynes’ Law and Say’s Law in the AD/AS Model

New home construction

This photograph shows a new house under construction.
At the peak of the housing bubble, many people across the country were able to secure the loans necessary to build new houses. (Credit: modification of work by Tim Pierce/Flickr Creative Commons)

From housing bubble to housing bust

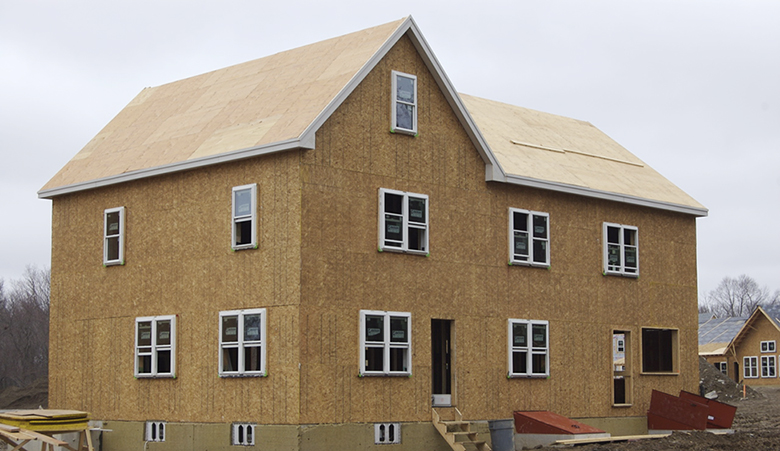
The United States experienced rising home ownership rates for most of the last two decades. Between 1990 and 2006, the U.S. housing market grew. Homeownership rates grew from 64% to a high of over 69% between 2004 and 2005. For many people, this was a period in which they could either buy first homes or buy a larger and more expensive home. During this time mortgage values tripled. Housing became more accessible to Americans and was considered to be a safe financial investment. [link] shows how new single family home sales peaked in 2005 at 107,000 units.

New single family houses sold

The figure shows that single family house sales were highest in 2005 (to over 12,000 thousand) before plummeting drastically. In 2014, housing sales were over 400 thousand.
From the early 1990s up through 2005, the number of new single family houses sold rose steadily. In 2006, the number dropped dramatically and this dramatic decline continued through 2011. By 2014, the number of new houses sold had begun to climb back up, but the levels are still lower than those of 1990. (Source: U.S. Census Bureau)

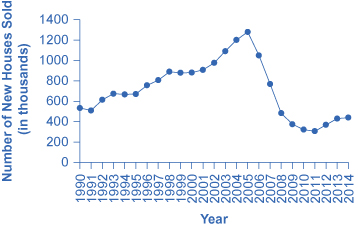
The housing bubble began to show signs of bursting in 2005, as delinquency and late payments began to grow and an oversupply of new homes on the market became apparent. Dropping home values contributed to a decrease in the overall wealth of the household sector and caused homeowners to pull back on spending. Several mortgage lenders were forced to file for bankruptcy because homeowners were not making their payments, and by 2008 the problem had spread throughout the financial markets. Lenders clamped down on credit and the housing bubble burst. Financial markets were now in crisis and unable or unwilling to even extend credit to credit-worthy customers.

The housing bubble and the crisis in the financial markets were major contributors to the Great Recession that led to unemployment rates over 10% and falling GDP. While the United States is still recovering from the impact of the Great Recession, it has made substantial progress in restoring financial market stability through the implementation of aggressive fiscal and monetary policy.

The economic history of the United States is cyclical in nature with recessions and expansions. Some of these fluctuations are severe, such as the economic downturn experienced during Great Depression of the 1930’s which lasted several years. Why does the economy grow at different rates in different years? What are the causes of the cyclical behavior of the economy? This chapter will introduce an important model, the aggregate demand–aggregate supply model, to begin our understanding of why economies expand and contract over time.

Introduction to the aggregate supply–aggregate demand model

In this chapter, you will learn about:

  • Macroeconomic Perspectives on Demand and Supply
  • Building a Model of Aggregate Supply and Aggregate Demand
  • Shifts in Aggregate Supply
  • Shifts in Aggregate Demand
  • How the AS–AD Model Incorporates Growth, Unemployment, and Inflation
  • Keynes’ Law and Say’s Law in the AS–AD Model

A key part of macroeconomics is the use of models to analyze macro issues and problems. How is the rate of economic growth connected to changes in the unemployment rate? Is there a reason why unemployment and inflation    seem to move in opposite directions: lower unemployment and higher inflation from 1997 to 2000, higher unemployment and lower inflation in the early 2000s, lower unemployment and higher inflation in the mid-2000s, and then higher unemployment and lower inflation in 2009? Why did the current account deficit rise so high, but then decline in 2009?

To analyze questions like these, we must move beyond discussing macroeconomic issues one at a time, and begin building economic models that will capture the relationships and interconnections between them. The next three chapters take up this task. This chapter introduces the macroeconomic model of aggregate supply and aggregate demand , how the two interact to reach a macroeconomic equilibrium, and how shifts in aggregate demand or aggregate supply will affect that equilibrium. This chapter also relates the model of aggregate supply and aggregate demand to the three goals of economic policy (growth, unemployment, and inflation), and provides a framework for thinking about many of the connections and tradeoffs between these goals. The chapter on The Keynesian Perspective focuses on the macroeconomy in the short run, where aggregate demand plays a crucial role. The chapter on The Neoclassical Perspective explores the macroeconomy in the long run, where aggregate supply plays a crucial role.

Questions & Answers

it is the relatively stable flow of income
Chidubem Reply
what is circular flow of income
Divine Reply
branches of macroeconomics
SHEDRACK Reply
what is Flexible exchang rate?
poudel Reply
is gdp a reliable measurement of wealth
Atega Reply
introduction to econometrics
Husseini Reply
Hi
mostafa
hi
LEMLEM
hello
Sammol
hi
Mahesh
bi
Ruqayat
hi
Ruqayat
Hi fellas
Nyawa
hey
Sammol
hi
God
hello
Jahara
Good morning
Jorge
hi
abubakar
hi
Nmesoma
hi
Mahesh
Hi
Tom
Why is unemployment rate never zero at full employment?
Priyanka Reply
bcoz of existence of frictional unemployment in our economy.
Umashankar
what is flexible exchang rate?
poudel
due to existence of the pple with disabilities
Abdulraufu
the demand of a good rises, causing the demand for another good to fall
Rushawn Reply
is it possible to leave every good at the same level
Joseph
I don't think so. because check it, if the demand for chicken increases, people will no longer consume fish like they used to causing a fall in the demand for fish
Anuolu
is not really possible to let the value of a goods to be same at the same time.....
Salome
Suppose the inflation rate is 6%, does it mean that all the goods you purchase will cost 6% more than previous year? Provide with reasoning.
Geetha Reply
Not necessarily. To measure the inflation rate economists normally use an averaged price index of a basket of certain goods. So if you purchase goods included in the basket, you will notice that you pay 6% more, otherwise not necessarily.
Waeth
discus major problems of macroeconomics
Alii Reply
what is the problem of macroeconomics
Yoal
Economic growth Stable prices and low unemployment
Ephraim
explain inflationcause and itis degre
Miresa Reply
what is inflation
Getu
increase in general price levels
WEETO
Good day How do I calculate this question: C= 100+5yd G= 2000 T= 2000 I(planned)=200. Suppose the actual output is 3000. What is the level of planned expenditures at this level of output?
Chisomo Reply
how to calculate actual output?
Chisomo
how to calculate the equilibrium income
Beshir
Criteria for determining money supply
Thapase Reply
who we can define macroeconomics in one line
Muhammad
Aggregate demand
Mohammed
C=k100 +9y and i=k50.calculate the equilibrium level of output
Mercy Reply
Hi
Isiaka
Hi
Geli
hy
Man
👋
Bahunda
hy how are you?
Man
ys
Amisha
how are you guys
Sekou
f9 guys
Amisha
how are you guys
Sekou
ys am also fine
Amisha
fine and you guys
Geli
from Nepal
Amisha
nawalparasi district from belatari
Amisha
nd u
Amisha
I am Camara from Guinea west Africa... happy to meet you guys here
Sekou
ma management ho
Amisha
ahile becheclor ho
Amisha
hjr ktm bta ho ani k kaam grnu hunxa tw
Amisha
belatari
Amisha
1st year ho
Amisha
nd u
Amisha
ahh
Amisha
kaha biratnagar
Amisha
ys
Amisha
kina k vo
Amisha
money as unit of account means what?
Kalombe
A unit of account is something that can be used to value goods and services and make calculations
Jim
all of you please speak in English I can't understand you're language
Muhammad
I want to know how can we define macroeconomics in one line
Muhammad
it must be .9 or 0.9 no Mpc is greater than 1 Y=100+.9Y+50 Y-.9Y=150 0.1Y/0.1=150/0.1 Y=1500
Kalombe
Mercy is it clear?😋
Kalombe
hi can someone help me on this question If a negative shocks shifts the IS curve to the left, what type of policy do you suggest so as to stabilize the level of output? discuss your answer using appropriate graph.
Galge Reply
if interest rate is increased this will will reduce the level of income shifting the curve to the left ◀️
Kalombe
Got questions? Join the online conversation and get instant answers!
Jobilize.com Reply

Get Jobilize Job Search Mobile App in your pocket Now!

Get it on Google Play Download on the App Store Now


Source:  OpenStax, Principles of economics. OpenStax CNX. Sep 19, 2014 Download for free at http://legacy.cnx.org/content/col11613/1.11
Google Play and the Google Play logo are trademarks of Google Inc.

Notification Switch

Would you like to follow the 'Principles of economics' conversation and receive update notifications?

Ask