

| << Chapter < Page | Chapter >> Page > |
| Cost Information | Revenue Information | ||||||
|---|---|---|---|---|---|---|---|
| Quantity | Total Cost | Marginal Cost | Average Cost | Quantity | Price | Total Revenue | Marginal Revenue |
| 1 | 1,500 | 1,500 | 1,500 | 1 | 1,200 | 1,200 | 1,200 |
| 2 | 1,800 | 300 | 900 | 2 | 1,100 | 2,200 | 1,000 |
| 3 | 2,200 | 400 | 733 | 3 | 1,000 | 3,000 | 800 |
| 4 | 2,800 | 600 | 700 | 4 | 900 | 3,600 | 600 |
| 5 | 3,500 | 700 | 700 | 5 | 800 | 4,000 | 400 |
| 6 | 4,200 | 700 | 700 | 6 | 700 | 4,200 | 200 |
| 7 | 5,600 | 1,400 | 800 | 7 | 600 | 4,200 | 0 |
| 8 | 7,400 | 1,800 | 925 | 8 | 500 | 4,000 | –200 |
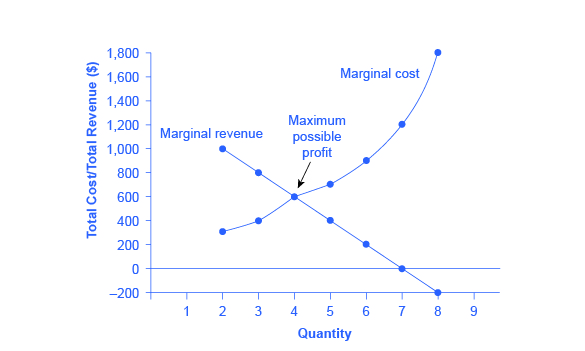
A monopolist can determine its profit-maximizing price and quantity by analyzing the marginal revenue and marginal costs of producing an extra unit. If the marginal revenue exceeds the marginal cost, then the firm should produce the extra unit.
For example, at an output of 3 in [link] , marginal revenue is 800 and marginal cost is 400, so producing this unit will clearly add to overall profits. At an output of 4, marginal revenue is 600 and marginal cost is 600, so producing this unit still means overall profits are unchanged. However, expanding output from 4 to 5 would involve a marginal revenue of 400 and a marginal cost of 700, so that fifth unit would actually reduce profits. Thus, the monopoly can tell from the marginal revenue and marginal cost that of the choices given in the table, the profit-maximizing level of output is 4.
Indeed, the monopoly could seek out the profit-maximizing level of output by increasing quantity by a small amount, calculating marginal revenue and marginal cost, and then either increasing output as long as marginal revenue exceeds marginal cost or reducing output if marginal cost exceeds marginal revenue. This process works without any need to calculate total revenue and total cost. Thus, a profit-maximizing monopoly should follow the rule of producing up to the quantity where marginal revenue is equal to marginal cost—that is, MR = MC.
If you find it counterintuitive that producing where marginal revenue equals marginal cost will maximize profits, working through the numbers will help.
Step 1. Remember that marginal cost is defined as the change in total cost from producing a small amount of additional output.
Step 2. Note that in [link] , as output increases from 1 to 2 units, total cost increases from $1500 to $1800. As a result, the marginal cost of the second unit will be:
Step 3. Remember that, similarly, marginal revenue is the change in total revenue from selling a small amount of additional output.
Step 4. Note that in [link] , as output increases from 1 to 2 units, total revenue increases from $1200 to $2200. As a result, the marginal revenue of the second unit will be:
Notification Switch
Would you like to follow the 'Principles of economics' conversation and receive update notifications?

|
|
|
|
|

|
|

|
|

|
|

|
|

|
|
|
|
|

|
|

|
|

|
|

|