<< Chapter < Page Chapter >> Page >

Traditional economists also assume human beings have complete self-control. But, for instance, people will buy cigarettes by the pack instead of the carton even though the carton saves them money, to keep usage down. They purchase locks for their refrigerators and overpay on taxes to force themselves to save. In other words, we protect ourselves from our worst temptations but pay a price to do so. One way behavioral economists are responding to this is by setting up ways for people to keep themselves free of these temptations. This includes what are called “nudges” toward more rational behavior rather than mandatory regulations from government. For example, up to 20 percent of new employees do not enroll in retirement savings plans immediately, because of procrastination or feeling overwhelmed by the different choices. Some companies are now moving to a new system, where employees are automatically enrolled unless they “opt out.” Almost no-one opts out in this program and employees begin saving at the early years, which are most critical for retirement.

Another area that seems illogical is the idea of mental accounting, or putting dollars in different mental categories where they take different values. Economists typically consider dollars to be fungible    , or having equal value to the individual, regardless of the situation.

You might, for instance, think of the $25 you found in the street differently from the $25 you earned from three hours working in a fast food restaurant. The street money might well be treated as “mad money” with little rational regard to getting the best value. This is in one sense strange, since it is still equivalent to three hours of hard work in the restaurant. Yet the “easy come-easy go” mentality replaces the rational economizer because of the situation, or context, in which the money was attained.

In another example of mental accounting that seems inconsistent to a traditional economist, a person could carry a credit card debt of $1,000 that has a 15% yearly interest cost, and simultaneously have a $2,000 savings account that pays only 2% per year. That means she pays $150 a year to the credit card company, while collecting only $40 annually in bank interest, so she loses $130 a year. That doesn’t seem wise.

The “rational” decision would be to pay off the debt, since a $1,000 savings account with $0 in debt is the equivalent net worth, and she would now net $20 per year. But curiously, it is not uncommon for people to ignore this advice, since they will treat a loss to their savings account as higher than the benefit of paying off their credit card. The dollars are not being treated as fungible so it looks irrational to traditional economists.

Which view is right, the behavioral economists’ or the traditional view? Both have their advantages, but behavioral economists have at least shed a light on trying to describe and explain behavior that has historically been dismissed as irrational. If most of us are engaged in some “irrational behavior,” perhaps there are deeper underlying reasons for this behavior in the first place.

"eeny, meeny, miney, moe"—making choices

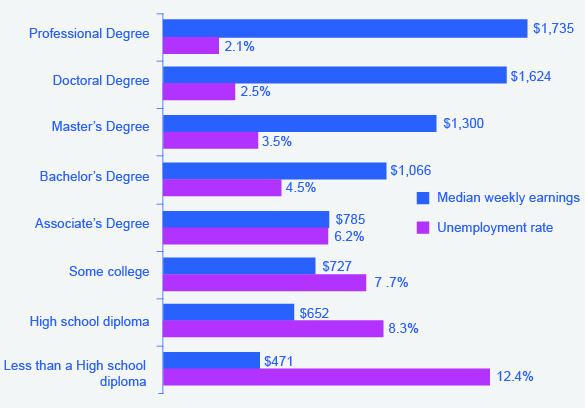
In what category did consumers worldwide increase their spending during the recession? Higher education. According to the United Nations Educational, Scientific, and Cultural Organization (UNESCO), enrollment in colleges and universities rose one-third in China and almost two-thirds in Saudi Arabia, nearly doubled in Pakistan, tripled in Uganda, and surged by three million—18 percent—in the United States. Why were consumers willing to spend on education during lean times? Both individuals and countries view higher education as the way to prosperity. Many feel that increased earnings are a significant benefit of attending college.

Bureau of Labor Statistics data from May 2012 supports this view, as shown in [link] . They show a positive correlation between earnings and education. The data also indicate that unemployment rates fall with higher levels of education and training.

The impact of education on earnings and unemployment rates, 2012

The graph shows the unemployment rate and median weekly earnings in 2012 for various levels of education. People with professional degrees made around $1,735 a week and suffered a 2.1% unemployment rate. People with doctoral degrees made around $1,624 a week and suffered a 2.5% unemployment rate. People with Master’s degrees made around $1,300 a week and suffered a 3.5% unemployment rate. People with Bachelor’s degrees made around $1,066 a week and suffered a 4.5% unemployment rate. People with Associate’s degrees made around $785 a week and suffered a 6.2% unemployment rate. People with some college, no degree made around $727 a week and suffered a 7.7% unemployment rate. People with a high school diploma made around $652 a week and suffered an 8.3% unemployment rate. People with less than a high school diploma made around $471 a week and suffered a 12.4% unemployment rate.
Those with the highest degrees in 2012 had substantially lower unemployment rates whereas those with the least formal education suffered from the highest unemployment rates. The national median average weekly income was $815, and the nation unemployment average in 2012 was 6.8%. (Source: Bureau of Labor Statistics, May 22, 2013)

Key concepts and summary

When making a choice along the intertemporal budget constraint, a household will choose the combination of present consumption, savings, and future consumption that provides the most utility. The result of a higher rate of return (or higher interest rates) can be a higher quantity of saving, the same quantity of saving, or a lower quantity of saving, depending on preferences about present and future consumption. Behavioral economics is a branch of economics that seeks to understand and explain the "human" factors that drive what traditional economists see as people's irrational spending decisions.

References

Holden, Sarah, and Daniel Schrass. 2012. “The rose of IRAs in U.S Households’ Saving for Retirement, 2012.” ICI Research Perspective 18.8 (2012). http://www.ici.org/pdf/per18-08.pdf.

Kahneman, Daniel and Amos Tversky. “Prospect Theory: An Analysis of Decision under Risk.” Econometrica 47.2 (March 1979) 263-291.

Thaler, Richard H. “Shifting Our Retirement Savings into Automatic.” The New York Times , April 6, 2013. http://www.nytimes.com/2013/04/07/business/an-automatic-solution-for-the-retirement-savings-problem.html?pagewanted=all.

UNESCO Institute for Statistics. “Statistics in Brief / Profiles” Accessed August 2013. http://stats.uis.unesco.org/unesco/TableViewer/document.aspx?ReportId=121&IF_Language=en&BR_Country=5580.

Questions & Answers

differentiate between demand and supply giving examples
Lambiv Reply
differentiated between demand and supply using examples
Lambiv
what is labour ?
Lambiv
how will I do?
Venny Reply
how is the graph works?I don't fully understand
Rezat Reply
information
Eliyee
devaluation
Eliyee
t
WARKISA
hi guys good evening to all
Lambiv
multiple choice question
Aster Reply
appreciation
Eliyee
explain perfect market
Lindiwe Reply
In economics, a perfect market refers to a theoretical construct where all participants have perfect information, goods are homogenous, there are no barriers to entry or exit, and prices are determined solely by supply and demand. It's an idealized model used for analysis,
Ezea
What is ceteris paribus?
Shukri Reply
other things being equal
AI-Robot
When MP₁ becomes negative, TP start to decline. Extuples Suppose that the short-run production function of certain cut-flower firm is given by: Q=4KL-0.6K2 - 0.112 • Where is quantity of cut flower produced, I is labour input and K is fixed capital input (K-5). Determine the average product of lab
Kelo
Extuples Suppose that the short-run production function of certain cut-flower firm is given by: Q=4KL-0.6K2 - 0.112 • Where is quantity of cut flower produced, I is labour input and K is fixed capital input (K-5). Determine the average product of labour (APL) and marginal product of labour (MPL)
Kelo
yes,thank you
Shukri
Can I ask you other question?
Shukri
what is monopoly mean?
Habtamu Reply
What is different between quantity demand and demand?
Shukri Reply
Quantity demanded refers to the specific amount of a good or service that consumers are willing and able to purchase at a give price and within a specific time period. Demand, on the other hand, is a broader concept that encompasses the entire relationship between price and quantity demanded
Ezea
ok
Shukri
how do you save a country economic situation when it's falling apart
Lilia Reply
what is the difference between economic growth and development
Fiker Reply
Economic growth as an increase in the production and consumption of goods and services within an economy.but Economic development as a broader concept that encompasses not only economic growth but also social & human well being.
Shukri
production function means
Jabir
What do you think is more important to focus on when considering inequality ?
Abdisa Reply
any question about economics?
Awais Reply
sir...I just want to ask one question... Define the term contract curve? if you are free please help me to find this answer 🙏
Asui
it is a curve that we get after connecting the pareto optimal combinations of two consumers after their mutually beneficial trade offs
Awais
thank you so much 👍 sir
Asui
In economics, the contract curve refers to the set of points in an Edgeworth box diagram where both parties involved in a trade cannot be made better off without making one of them worse off. It represents the Pareto efficient allocations of goods between two individuals or entities, where neither p
Cornelius
In economics, the contract curve refers to the set of points in an Edgeworth box diagram where both parties involved in a trade cannot be made better off without making one of them worse off. It represents the Pareto efficient allocations of goods between two individuals or entities,
Cornelius
Suppose a consumer consuming two commodities X and Y has The following utility function u=X0.4 Y0.6. If the price of the X and Y are 2 and 3 respectively and income Constraint is birr 50. A,Calculate quantities of x and y which maximize utility. B,Calculate value of Lagrange multiplier. C,Calculate quantities of X and Y consumed with a given price. D,alculate optimum level of output .
Feyisa Reply
Answer
Feyisa
c
Jabir
the market for lemon has 10 potential consumers, each having an individual demand curve p=101-10Qi, where p is price in dollar's per cup and Qi is the number of cups demanded per week by the i th consumer.Find the market demand curve using algebra. Draw an individual demand curve and the market dema
Gsbwnw Reply
suppose the production function is given by ( L, K)=L¼K¾.assuming capital is fixed find APL and MPL. consider the following short run production function:Q=6L²-0.4L³ a) find the value of L that maximizes output b)find the value of L that maximizes marginal product
Abdureman
types of unemployment
Yomi Reply
What is the difference between perfect competition and monopolistic competition?
Mohammed

Get Jobilize Job Search Mobile App in your pocket Now!

Get it on Google Play Download on the App Store Now


Source:  OpenStax, Principles of economics. OpenStax CNX. Sep 19, 2014 Download for free at http://legacy.cnx.org/content/col11613/1.11
Google Play and the Google Play logo are trademarks of Google Inc.

Notification Switch

Would you like to follow the 'Principles of economics' conversation and receive update notifications?

Ask