

| << Chapter < Page | Chapter >> Page > |
By the end of this section, you will be able to:
Prices exist in markets for goods and services, for labor, and for financial capital. In all of these markets, prices serve as a remarkable social mechanism for collecting, combining, and transmitting information that is relevant to the market—namely, the relationship between demand and supply—and then serving as messengers to convey that information to buyers and sellers. In a market-oriented economy, no government agency or guiding intelligence oversees the set of responses and interconnections that result from a change in price. Instead, each consumer reacts according to that person’s preferences and budget set, and each profit-seeking producer reacts to the impact on its expected profits. The following Clear It Up feature examines the demand and supply models .
The demand and supply model is the second fundamental diagram for this course. (The opportunity set model introduced in the Choice in a World of Scarcity chapter was the first.) Just as it would be foolish to try to learn the arithmetic of long division by memorizing every possible combination of numbers that can be divided by each other, it would be foolish to try to memorize every specific example of demand and supply in this chapter, this textbook, or this course. Demand and supply is not primarily a list of examples; it is a model to analyze prices and quantities. Even though demand and supply diagrams have many labels, they are fundamentally the same in their logic. Your goal should be to understand the underlying model so you can use it to analyze any market.
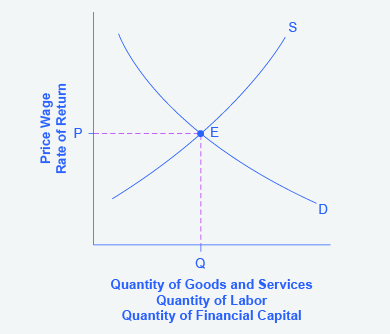
[link] displays a generic demand and supply curve. The horizontal axis shows the different measures of quantity: a quantity of a good or service, or a quantity of labor for a given job, or a quantity of financial capital. The vertical axis shows a measure of price: the price of a good or service, the wage in the labor market, or the rate of return (like the interest rate) in the financial market.
The demand and supply model can explain the existing levels of prices, wages, and rates of return. To carry out such an analysis, think about the quantity that will be demanded at each price and the quantity that will be supplied at each price—that is, think about the shape of the demand and supply curves—and how these forces will combine to produce equilibrium.
Demand and supply can also be used to explain how economic events will cause changes in prices, wages, and rates of return. There are only four possibilities: the change in any single event may cause the demand curve to shift right or to shift left; or it may cause the supply curve to shift right or to shift left. The key to analyzing the effect of an economic event on equilibrium prices and quantities is to determine which of these four possibilities occurred. The way to do this correctly is to think back to the list of factors that shift the demand and supply curves. Note that if more than one variable is changing at the same time, the overall impact will depend on the degree of the shifts; when there are multiple variables, economists isolate each change and analyze it independently.
Notification Switch
Would you like to follow the 'Principles of economics' conversation and receive update notifications?

|
|

|
|

|
|

|
|

|
|

|
|

|
|

|
|

|
|

|
|

|