<< Chapter < Page Chapter >> Page >

By the end of this section, you will be able to:

  • Apply Ricardian equivalence to evaluate how government borrowing affects private saving
  • Interpret a graphic representation of Ricardian equivalence

A change in government budgets may impact private saving. Imagine that people watch government budgets and adjust their savings accordingly. For example, whenever the government runs a budget deficit, people might reason: “Well, a higher budget deficit means that I’m just going to owe more taxes in the future to pay off all that government borrowing, so I’ll start saving now.” If the government runs budget surpluses, people might reason: “With these budget surpluses (or lower budget deficits), interest rates are falling, so that saving is less attractive. Moreover, with a budget surplus the country will be able to afford a tax cut sometime in the future. I won’t bother saving as much now.”

The theory that rational private households might shift their saving to offset government saving or borrowing is known as Ricardian equivalence    because the idea has intellectual roots in the writings of the early nineteenth-century economist David Ricardo (1772–1823). If Ricardian equivalence holds completely true, then in the national saving and investment identity, any change in budget deficits or budget surpluses would be completely offset by a corresponding change in private saving. As a result, changes in government borrowing would have no effect at all on either physical capital investment or trade balances.

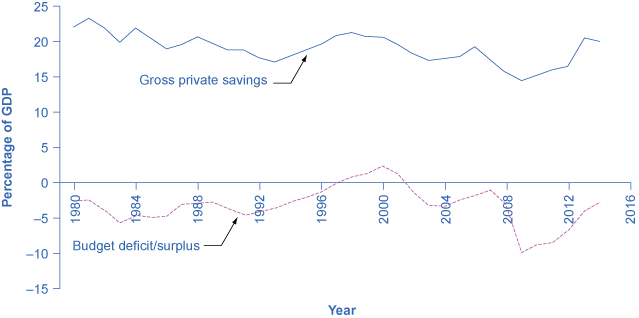
In practice, the private sector only sometimes and partially adjusts its savings behavior to offset government budget deficits and surpluses. [link] shows the patterns of U.S. government budget deficits and surpluses and the rate of private saving—which includes saving by both households and firms—since 1980. The connection between the two is not at all obvious. In the mid-1980s, for example, government budget deficits were quite large, but there is no corresponding surge of private saving. However, when budget deficits turn to surpluses in the late 1990s, there is a simultaneous decline in private saving. When budget deficits get very large in 2008 and 2009, on the other hand, there is some sign of a rise in saving. A variety of statistical studies based on the U.S. experience suggests that when government borrowing increases by $1, private saving rises by about 30 cents. A World Bank study done in the late 1990s, looking at government budgets and private saving behavior in countries around the world, found a similar result.

U.s. budget deficits and private savings

The graph shows that government borrowing and private investment sometimes rise and fall together. For example, between 1980 and 1984 the deficit as a percentage of GDP fell from –5 to –2% and the gross private savings as a percentage of GDP also fell from 22% to 20%. In 2014, the gross private savings as around 20%, and the budget deficit/surplus was closer to –3%.
The theory of Ricardian equivalence suggests that any increase in government borrowing will be offset by additional private saving, while any decrease in government borrowing will be offset by reduced private saving. Sometimes this theory holds true, and sometimes it does not hold true at all. (Source: Bureau of Economic Analysis and Federal Reserve Economic Data)

So private saving does increase to some extent when governments run large budget deficits, and private saving falls when governments reduce deficits or run large budget surpluses. However, the offsetting effects of private saving compared to government borrowing are much less than one-to-one. In addition, this effect can vary a great deal from country to country, from time to time, and over the short run and the long run.

If the funding for a larger budget deficit comes from international financial investors, then a budget deficit may be accompanied by a trade deficit. In some countries, this pattern of a twin deficits    has set the stage for international financial investors first to send their funds to a country and cause an appreciation of its exchange rate and then to pull their funds out and cause a depreciation of the exchange rate and a financial crisis as well. It depends on whether funding comes from international financial investors.

Key concepts and summary

The theory of Ricardian equivalence holds that changes in government borrowing or saving will be offset by changes in private saving. Thus, higher budget deficits will be offset by greater private saving, while larger budget surpluses will be offset by greater private borrowing. If the theory holds true, then changes in government borrowing or saving would have no effect on private investment in physical capital or on the trade balance. However, empirical evidence suggests that the theory holds true only partially.

Problems

Illustrate the concept of Ricardian equivalence using the demand and supply of financial capital graph.

Got questions? Get instant answers now!

Questions & Answers

differentiate between demand and supply giving examples
Lambiv Reply
differentiated between demand and supply using examples
Lambiv
what is labour ?
Lambiv
how will I do?
Venny Reply
how is the graph works?I don't fully understand
Rezat Reply
information
Eliyee
devaluation
Eliyee
t
WARKISA
hi guys good evening to all
Lambiv
multiple choice question
Aster Reply
appreciation
Eliyee
explain perfect market
Lindiwe Reply
In economics, a perfect market refers to a theoretical construct where all participants have perfect information, goods are homogenous, there are no barriers to entry or exit, and prices are determined solely by supply and demand. It's an idealized model used for analysis,
Ezea
What is ceteris paribus?
Shukri Reply
other things being equal
AI-Robot
When MP₁ becomes negative, TP start to decline. Extuples Suppose that the short-run production function of certain cut-flower firm is given by: Q=4KL-0.6K2 - 0.112 • Where is quantity of cut flower produced, I is labour input and K is fixed capital input (K-5). Determine the average product of lab
Kelo
Extuples Suppose that the short-run production function of certain cut-flower firm is given by: Q=4KL-0.6K2 - 0.112 • Where is quantity of cut flower produced, I is labour input and K is fixed capital input (K-5). Determine the average product of labour (APL) and marginal product of labour (MPL)
Kelo
yes,thank you
Shukri
Can I ask you other question?
Shukri
what is monopoly mean?
Habtamu Reply
What is different between quantity demand and demand?
Shukri Reply
Quantity demanded refers to the specific amount of a good or service that consumers are willing and able to purchase at a give price and within a specific time period. Demand, on the other hand, is a broader concept that encompasses the entire relationship between price and quantity demanded
Ezea
ok
Shukri
how do you save a country economic situation when it's falling apart
Lilia Reply
what is the difference between economic growth and development
Fiker Reply
Economic growth as an increase in the production and consumption of goods and services within an economy.but Economic development as a broader concept that encompasses not only economic growth but also social & human well being.
Shukri
production function means
Jabir
What do you think is more important to focus on when considering inequality ?
Abdisa Reply
any question about economics?
Awais Reply
sir...I just want to ask one question... Define the term contract curve? if you are free please help me to find this answer 🙏
Asui
it is a curve that we get after connecting the pareto optimal combinations of two consumers after their mutually beneficial trade offs
Awais
thank you so much 👍 sir
Asui
In economics, the contract curve refers to the set of points in an Edgeworth box diagram where both parties involved in a trade cannot be made better off without making one of them worse off. It represents the Pareto efficient allocations of goods between two individuals or entities, where neither p
Cornelius
In economics, the contract curve refers to the set of points in an Edgeworth box diagram where both parties involved in a trade cannot be made better off without making one of them worse off. It represents the Pareto efficient allocations of goods between two individuals or entities,
Cornelius
Suppose a consumer consuming two commodities X and Y has The following utility function u=X0.4 Y0.6. If the price of the X and Y are 2 and 3 respectively and income Constraint is birr 50. A,Calculate quantities of x and y which maximize utility. B,Calculate value of Lagrange multiplier. C,Calculate quantities of X and Y consumed with a given price. D,alculate optimum level of output .
Feyisa Reply
Answer
Feyisa
c
Jabir
the market for lemon has 10 potential consumers, each having an individual demand curve p=101-10Qi, where p is price in dollar's per cup and Qi is the number of cups demanded per week by the i th consumer.Find the market demand curve using algebra. Draw an individual demand curve and the market dema
Gsbwnw Reply
suppose the production function is given by ( L, K)=L¼K¾.assuming capital is fixed find APL and MPL. consider the following short run production function:Q=6L²-0.4L³ a) find the value of L that maximizes output b)find the value of L that maximizes marginal product
Abdureman
types of unemployment
Yomi Reply
What is the difference between perfect competition and monopolistic competition?
Mohammed

Get Jobilize Job Search Mobile App in your pocket Now!

Get it on Google Play Download on the App Store Now


Source:  OpenStax, Principles of economics. OpenStax CNX. Sep 19, 2014 Download for free at http://legacy.cnx.org/content/col11613/1.11
Google Play and the Google Play logo are trademarks of Google Inc.

Notification Switch

Would you like to follow the 'Principles of economics' conversation and receive update notifications?

Ask