<< Chapter < Page Chapter >> Page >
By the end of this section, you will be able to:
  • Explain the Phillips curve, noting its impact on the theories of Keynesian economics
  • Graph a Phillips curve
  • Identify factors that cause the instability of the Phillips curve
  • Analyze the Keynesian policy for reducing unemployment and inflation

The simplified AD/AS model that we have used so far is fully consistent with Keynes’s original model. More recent research, though, has indicated that in the real world, an aggregate supply curve is more curved than the right angle used in this chapter. Rather, the real-world AS curve is very flat at levels of output far below potential (“the Keynesian zone”), very steep at levels of output above potential (“the neoclassical zone”) and curved in between (“the intermediate zone”). This is illustrated in [link] . The typical aggregate supply curve leads to the concept of the Phillips curve.
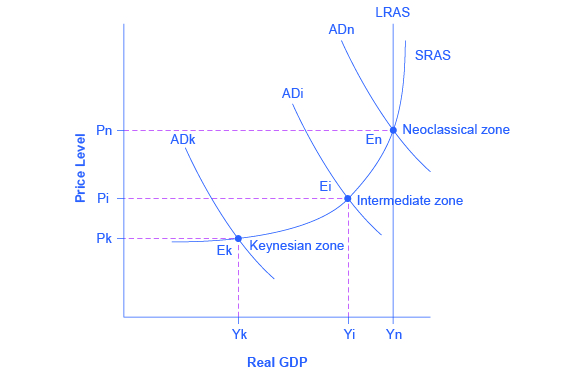
Keynes, neoclassical, and intermediate zones in the aggregate supply curve

The graph shows three aggregate demand curves to represent different zones: the Keynesian zone, the intermediate zone, and the neoclassical zone. The Keynesian zone is farthest to the left as well as the lowest; the intermediate zone is the center of the three curves; the neoclassical is farthest to the right as well as the highest.
Near the equilibrium Ek, in the Keynesian zone at the far left of the SRAS curve, small shifts in AD, either to the right or the left, will affect the output level Yk, but will not much affect the price level. In the Keynesian zone, AD largely determines the quantity of output. Near the equilibrium En, in the neoclassical zone, at the far right of the SRAS curve, small shifts in AD, either to the right or the left, will have relatively little effect on the output level Yn, but instead will have a greater effect on the price level. In the neoclassical zone, the near-vertical SRAS curve close to the level of potential GDP (as represented by the LRAS line) largely determines the quantity of output. In the intermediate zone around equilibrium Ei, movement in AD to the right will increase both the output level and the price level, while a movement in AD to the left would decrease both the output level and the price level.

The discovery of the phillips curve

In the 1950s, A.W. Phillips , an economist at the London School of Economics, was studying the Keynesian analytical framework. The Keynesian theory implied that during a recession inflationary pressures are low, but when the level of output is at or even pushing beyond potential GDP, the economy is at greater risk for inflation. Phillips analyzed 60 years of British data and did find that tradeoff between unemployment and inflation, which became known as a Phillips curve    . [link] shows a theoretical Phillips curve, and the following Work It Out feature shows how the pattern appears for the United States.
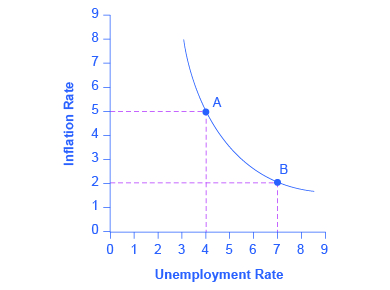
A keynesian phillips curve tradeoff between unemployment and inflation

The graph provides a visual representation of the Phillips curve with a downward-sloping curve.
A Phillips curve illustrates a tradeoff between the unemployment rate and the inflation rate; if one is higher, the other must be lower. For example, point A illustrates an inflation rate of 5% and an unemployment rate of 4%. If the government attempts to reduce inflation to 2%, then it will experience a rise in unemployment to 7%, as shown at point B.

The phillips curve for the united states

Step 1. Go to this website to see the 2005 Economic Report of the President.

Step 2. Scroll down and locate Table B-63 in the Appendices. This table is titled “Changes in special consumer price indexes, 1960–2004.”

Step 3. Download the table in Excel by selecting the XLS option and then selecting the location in which to save the file.

Step 4. Open the downloaded Excel file.

Step 5. View the third column (labeled “Year to year”). This is the inflation rate, measured by the percentage change in the Consumer Price Index.

Step 6. Return to the website and scroll to locate the Appendix Table B-42 “Civilian unemployment rate, 1959–2004.

Step 7. Download the table in Excel.

Step 8. Open the downloaded Excel file and view the second column. This is the overall unemployment rate.

Step 9. Using the data available from these two tables, plot the Phillips curve for 1960–69, with unemployment rate on the x-axis and the inflation rate on the y-axis. Your graph should look like [link] .
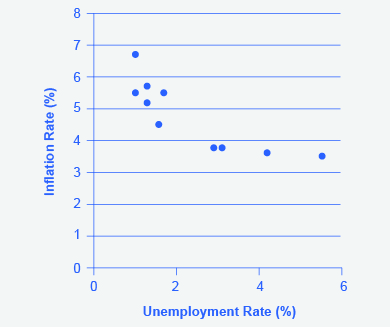
The phillips curve from 1960–1969

The Phillips Curve shows a clear negative relationship between the unemployment rate and the inflation rate over the period 1960-69.
This chart shows the negative relationship between unemployment and inflation.

Step 10. Plot the Phillips curve for 1960–1979. What does the graph look like? Do you still see the tradeoff between inflation and unemployment? Your graph should look like [link] .
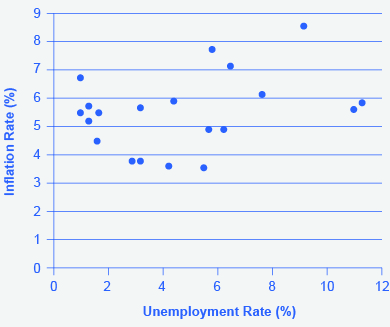
U.s. phillips curve, 1960–1979

The tradeoff between unemployment and inflation appeared to break down during the 1970s as the Phillips Curve shifted out to the right, meaning a given unemployment rate corresponds to a variety of rates of inflation and vice versa.
The tradeoff between unemployment and inflation appeared to break down during the 1970s as the Phillips Curve shifted out to the right.

Over this longer period of time, the Phillips curve appears to have shifted out. There is no tradeoff any more.

Questions & Answers

A golfer on a fairway is 70 m away from the green, which sits below the level of the fairway by 20 m. If the golfer hits the ball at an angle of 40° with an initial speed of 20 m/s, how close to the green does she come?
Aislinn Reply
cm
tijani
what is titration
John Reply
what is physics
Siyaka Reply
A mouse of mass 200 g falls 100 m down a vertical mine shaft and lands at the bottom with a speed of 8.0 m/s. During its fall, how much work is done on the mouse by air resistance
Jude Reply
Can you compute that for me. Ty
Jude
what is the dimension formula of energy?
David Reply
what is viscosity?
David
what is inorganic
emma Reply
what is chemistry
Youesf Reply
what is inorganic
emma
Chemistry is a branch of science that deals with the study of matter,it composition,it structure and the changes it undergoes
Adjei
please, I'm a physics student and I need help in physics
Adjanou
chemistry could also be understood like the sexual attraction/repulsion of the male and female elements. the reaction varies depending on the energy differences of each given gender. + masculine -female.
Pedro
A ball is thrown straight up.it passes a 2.0m high window 7.50 m off the ground on it path up and takes 1.30 s to go past the window.what was the ball initial velocity
Krampah Reply
2. A sled plus passenger with total mass 50 kg is pulled 20 m across the snow (0.20) at constant velocity by a force directed 25° above the horizontal. Calculate (a) the work of the applied force, (b) the work of friction, and (c) the total work.
Sahid Reply
you have been hired as an espert witness in a court case involving an automobile accident. the accident involved car A of mass 1500kg which crashed into stationary car B of mass 1100kg. the driver of car A applied his brakes 15 m before he skidded and crashed into car B. after the collision, car A s
Samuel Reply
can someone explain to me, an ignorant high school student, why the trend of the graph doesn't follow the fact that the higher frequency a sound wave is, the more power it is, hence, making me think the phons output would follow this general trend?
Joseph Reply
Nevermind i just realied that the graph is the phons output for a person with normal hearing and not just the phons output of the sound waves power, I should read the entire thing next time
Joseph
Follow up question, does anyone know where I can find a graph that accuretly depicts the actual relative "power" output of sound over its frequency instead of just humans hearing
Joseph
"Generation of electrical energy from sound energy | IEEE Conference Publication | IEEE Xplore" ***ieeexplore.ieee.org/document/7150687?reload=true
Ryan
what's motion
Maurice Reply
what are the types of wave
Maurice
answer
Magreth
progressive wave
Magreth
hello friend how are you
Muhammad Reply
fine, how about you?
Mohammed
hi
Mujahid
A string is 3.00 m long with a mass of 5.00 g. The string is held taut with a tension of 500.00 N applied to the string. A pulse is sent down the string. How long does it take the pulse to travel the 3.00 m of the string?
yasuo Reply
Who can show me the full solution in this problem?
Reofrir Reply
Got questions? Join the online conversation and get instant answers!
Jobilize.com Reply

Get Jobilize Job Search Mobile App in your pocket Now!

Get it on Google Play Download on the App Store Now


Source:  OpenStax, Principles of economics. OpenStax CNX. Sep 19, 2014 Download for free at http://legacy.cnx.org/content/col11613/1.11
Google Play and the Google Play logo are trademarks of Google Inc.

Notification Switch

Would you like to follow the 'Principles of economics' conversation and receive update notifications?

Ask