<< Chapter < Page Chapter >> Page >
By the end of this section, you will be able to:
  • Explain the aggregate supply curve and how it relates to real GDP and potential GDP
  • Explain the aggregate demand curve and how it is influenced by price levels
  • Interpret the aggregate demand/aggregate supply model
  • Identify the point of equilibrium in the aggregate demand/aggregate supply model
  • Define short run aggregate supply and long run aggregate supply

To build a useful macroeconomic model, we need a model that shows what determines total supply or total demand for the economy, and how total demand and total supply interact at the macroeconomic level. This model is called the aggregate demand/aggregate supply model    . This module will explain aggregate supply, aggregate demand, and the equilibrium between them. The following modules will discuss the causes of shifts in aggregate supply and aggregate demand.

The aggregate supply curve and potential gdp

Firms make decisions about what quantity to supply based on the profits they expect to earn. Profits, in turn, are also determined by the price of the outputs the firm sells and by the price of the inputs, like labor or raw materials, the firm needs to buy. Aggregate supply (AS) refers to the total quantity of output (i.e. real GDP) firms will produce and sell. The aggregate supply (AS) curve    shows the total quantity of output (i.e. real GDP) that firms will produce and sell at each price level.

[link] shows an aggregate supply curve. In the following paragraphs, we will walk through the elements of the diagram one at a time: the horizontal and vertical axes, the aggregate supply curve itself, and the meaning of the potential GDP vertical line.

The aggregate supply curve

The graph shows an upward sloping aggregate supply curve. The slope is gradual between 6,500 and 9,000 before become steeper, especially between 9,500 and 9,900.
Aggregate supply (AS) slopes up, because as the price level for outputs rises, with the price of inputs remaining fixed, firms have an incentive to produce more and to earn higher profits. The potential GDP line shows the maximum that the economy can produce with full employment of workers and physical capital.

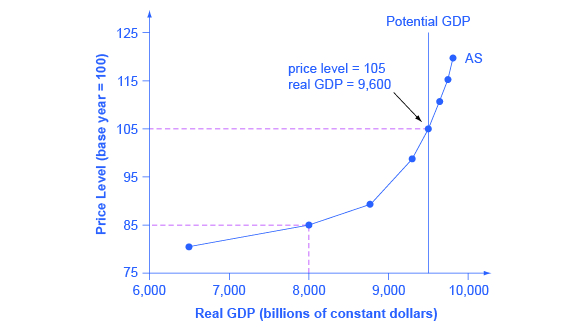
The horizontal axis of the diagram shows real GDP—that is, the level of GDP adjusted for inflation. The vertical axis shows the price level. Remember that the price level is different from the inflation rate. Visualize the price level as an index number, like the GDP deflator, while the inflation rate is the percentage change between price levels over time.

As the price level (the average price of all goods and services produced in the economy) rises, the aggregate quantity of goods and services supplied rises as well. Why? The price level shown on the vertical axis represents prices for final goods or outputs bought in the economy—like the GDP deflator—not the price level for intermediate goods and services that are inputs to production. Thus, the AS curve describes how suppliers will react to a higher price level for final outputs of goods and services, while holding the prices of inputs like labor and energy constant. If firms across the economy face a situation where the price level of what they produce and sell is rising, but their costs of production are not rising, then the lure of higher profits will induce them to expand production.

Questions & Answers

what does mean opportunity cost?
Aster Reply
what is poetive effect of population growth
Solomon Reply
what is inflation
Nasir Reply
what is demand
Eleni
what is economics
IMLAN Reply
economics theory describes individual behavior as the result of a process of optimization under constraints the objective to be reached being determined by
Kalkidan
Economics is a branch of social science that deal with How to wise use of resource ,s
Kassie
need
WARKISA
Economic Needs: In economics, needs are goods or services that are necessary for maintaining a certain standard of living. This includes things like healthcare, education, and transportation.
Kalkidan
What is demand and supply
EMPEROR Reply
deman means?
Alex
what is supply?
Alex
ex play supply?
Alex
Money market is a branch or segment of financial market where short-term debt instruments are traded upon. The instruments in this market includes Treasury bills, Bonds, Commercial Papers, Call money among other.
murana Reply
good
Kayode
what is money market
umar Reply
Examine the distinction between theory of comparative cost Advantage and theory of factor proportion
Fatima Reply
What is inflation
Bright Reply
a general and ongoing rise in the level of prices in an economy
AI-Robot
What are the factors that affect demand for a commodity
Florence Reply
price
Kenu
differentiate between demand and supply giving examples
Lambiv Reply
differentiated between demand and supply using examples
Lambiv
what is labour ?
Lambiv
how will I do?
Venny Reply
how is the graph works?I don't fully understand
Rezat Reply
information
Eliyee
devaluation
Eliyee
t
WARKISA
hi guys good evening to all
Lambiv
multiple choice question
Aster Reply
appreciation
Eliyee
explain perfect market
Lindiwe Reply
In economics, a perfect market refers to a theoretical construct where all participants have perfect information, goods are homogenous, there are no barriers to entry or exit, and prices are determined solely by supply and demand. It's an idealized model used for analysis,
Ezea

Get Jobilize Job Search Mobile App in your pocket Now!

Get it on Google Play Download on the App Store Now


Source:  OpenStax, Principles of economics. OpenStax CNX. Sep 19, 2014 Download for free at http://legacy.cnx.org/content/col11613/1.11
Google Play and the Google Play logo are trademarks of Google Inc.

Notification Switch

Would you like to follow the 'Principles of economics' conversation and receive update notifications?

Ask