Explain historical patterns of unemployment in the U.S.
Identify trends of unemployment based on demographics
Evaluate global unemployment rates
Let’s look at how unemployment rates have changed over time and how various groups of people are affected by unemployment differently.
The historical u.s. unemployment rate
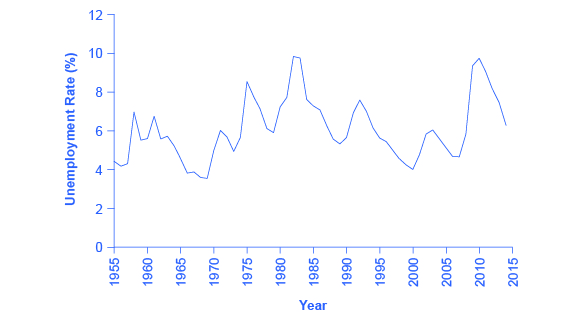
[link] shows the historical pattern of U.S. unemployment since 1955.
The u.s. unemployment rate, 1955–2015
The U.S. unemployment rate moves up and down as the economy moves in and out of recessions. But over time, the unemployment rate seems to return to a range of 4% to 6%. There does not seem to be a long-term trend toward the rate moving generally higher or generally lower. (Source:
Federal Reserve Economic Data (FRED) https://research.stlouisfed.org/fred2/series/LRUN64TTUSA156S0)
As we look at this data, several patterns stand out:
Unemployment rates do fluctuate over time. During the deep recessions of the early 1980s and of 2007–2009, unemployment reached roughly 10%. For comparison, during the Great Depression of the 1930s, the unemployment rate reached almost 25% of the labor force.
Unemployment rates in the late 1990s and into the mid-2000s were rather low by historical standards. The unemployment rate was below 5% from 1997 to 2000 and near 5% during almost all of 2006–2007. The previous time unemployment had been less than 5% for three consecutive years was three decades earlier, from 1968 to 1970.
The unemployment rate never falls all the way to zero. Indeed, it never seems to get below 3%—and it stays that low only for very short periods. (Reasons why this is the case are discussed later in this chapter.)
The timing of rises and falls in unemployment matches fairly well with the timing of upswings and downswings in the overall economy. During periods of
recession and
depression , unemployment is high. During periods of economic growth, unemployment tends to be lower.
No significant upward or downward trend in unemployment rates is apparent. This point is especially worth noting because the U.S. population nearly quadrupled from 76 million in 1900 to over 314 million by 2012. Moreover, a higher proportion of U.S. adults are now in the paid workforce, because women have entered the paid labor force in significant numbers in recent decades. Women composed 18% of the paid workforce in 1900 and nearly half of the paid workforce in 2012. But despite the increased number of workers, as well as other economic events like globalization and the continuous invention of new technologies, the economy has provided jobs without causing any long-term upward or downward trend in unemployment rates.
Unemployment rates by group
Unemployment is not distributed evenly across the U.S. population.
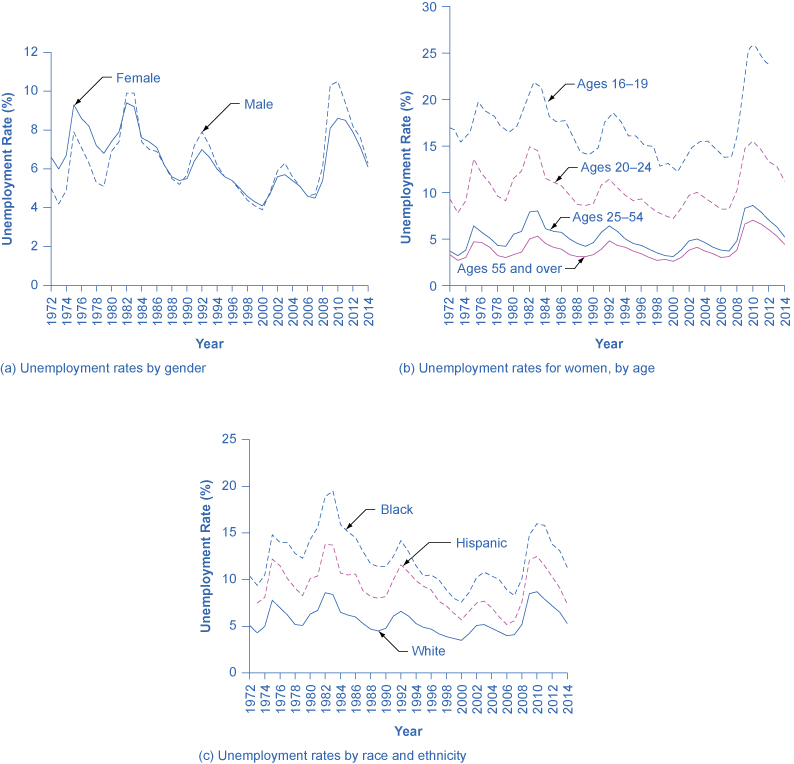
[link] shows unemployment rates broken down in various ways: by gender, age, and race/ethnicity.
Unemployment rate by demographic group
(a) By gender, 1972–2014. Unemployment rates for men used to be lower than unemployment rates for women, but in recent decades, the two rates have been very close, often with the unemployment rate for men somewhat higher. (b) By age, 1972–2014. Unemployment rates are highest for the very young and become lower with age. (c) By race and ethnicity, 1972–2014. Although unemployment rates for all groups tend to rise and fall together, the unemployment rate for whites has been lower than the unemployment rate for blacks and Hispanics in recent decades. (Source: www.bls.gov)
Bacteria doesn't produce energy they are dependent upon their substrate in case of lack of nutrients they are able to make spores which helps them to sustain in harsh environments
_Adnan
But not all bacteria make spores, l mean Eukaryotic cells have Mitochondria which acts as powerhouse for them, since bacteria don't have it, what is the substitution for it?
Assimilatory nitrate reduction is a process that occurs in some microorganisms, such as bacteria and archaea, in which nitrate (NO3-) is reduced to nitrite (NO2-), and then further reduced to ammonia (NH3).
Elkana
This process is called assimilatory nitrate reduction because the nitrogen that is produced is incorporated in the cells of microorganisms where it can be used in the synthesis of amino acids and other nitrogen products
There are nothing like emergency disease but there are some common medical emergency which can occur simultaneously like Bleeding,heart attack,Breathing difficulties,severe pain heart stock.Hope you will get my point .Have a nice day ❣️
_Adnan
define infection ,prevention and control
Innocent
I think infection prevention and control is the avoidance of all things we do that gives out break of infections and promotion of health practices that promote life