<< Chapter < Page Chapter >> Page >
The area under the velocity vs. time graph gives the displacement.

The displacement of the object is given by the area under the graph, which is 0 m . This is obvious, because the object is not moving.

Motion at constant velocity

Motion at a constant velocity or uniform motion means that the position of the object is changing at the same rate.
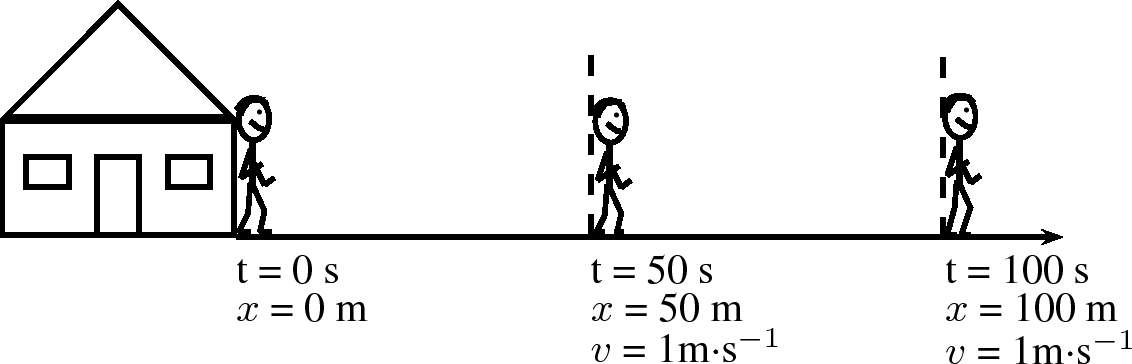
Assume that Lesedi takes 100 s to walk the 100 m to the taxi-stop every morning. If we assume that Lesedi's house is the origin, then Lesedi's velocity is:

v = Δ x Δ t = x f - x i t f - t i = 100 m - 0 m 100 s - 0 s = 1 m · s - 1

Lesedi's velocity is 1 m · s - 1 . This means that he walked 1 m in the first second, another metre in the second second, and another in the third second, and so on. For example, after 50 s he will be 50 m from home. His position increases by 1 m every 1 s . A diagram of Lesedi's position is shown in [link] .

Diagram showing Lesedi's motion at a constant velocity of 1 m · s - 1

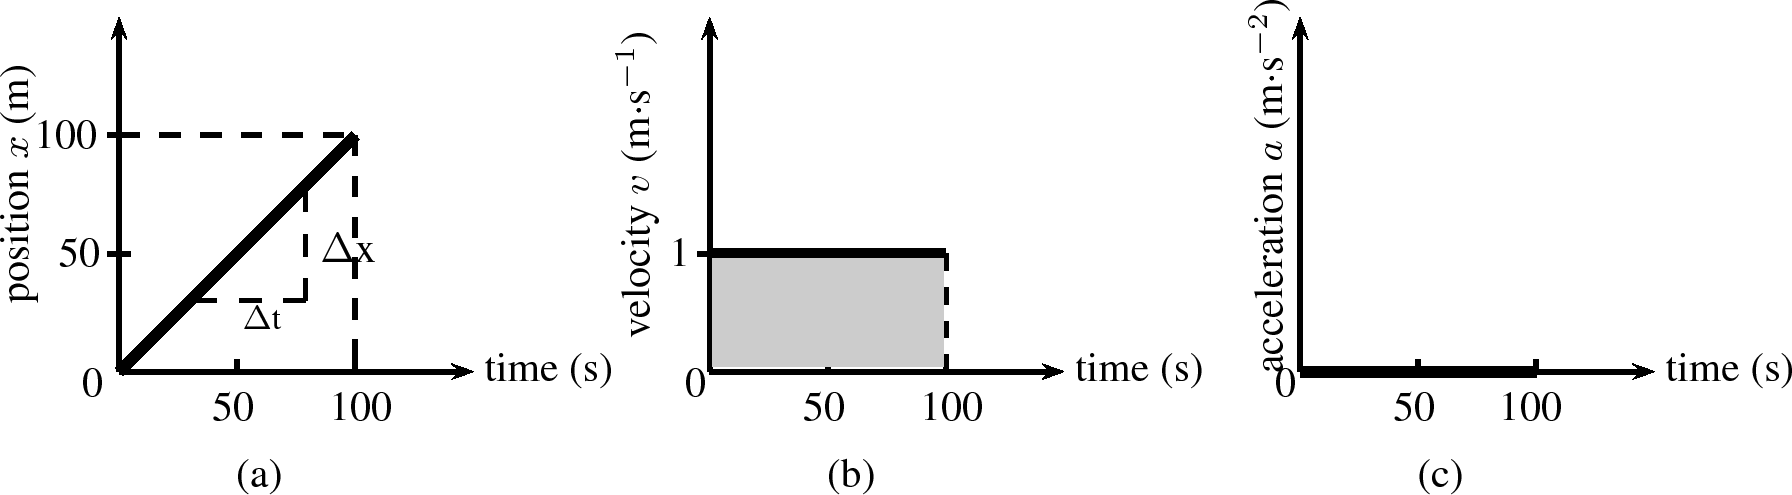
We can now draw graphs of position vs.time ( x vs. t ), velocity vs.time ( v vs. t ) and acceleration vs.time ( a vs. t ) for Lesedi moving at a constant velocity. The graphs are shown in [link] .
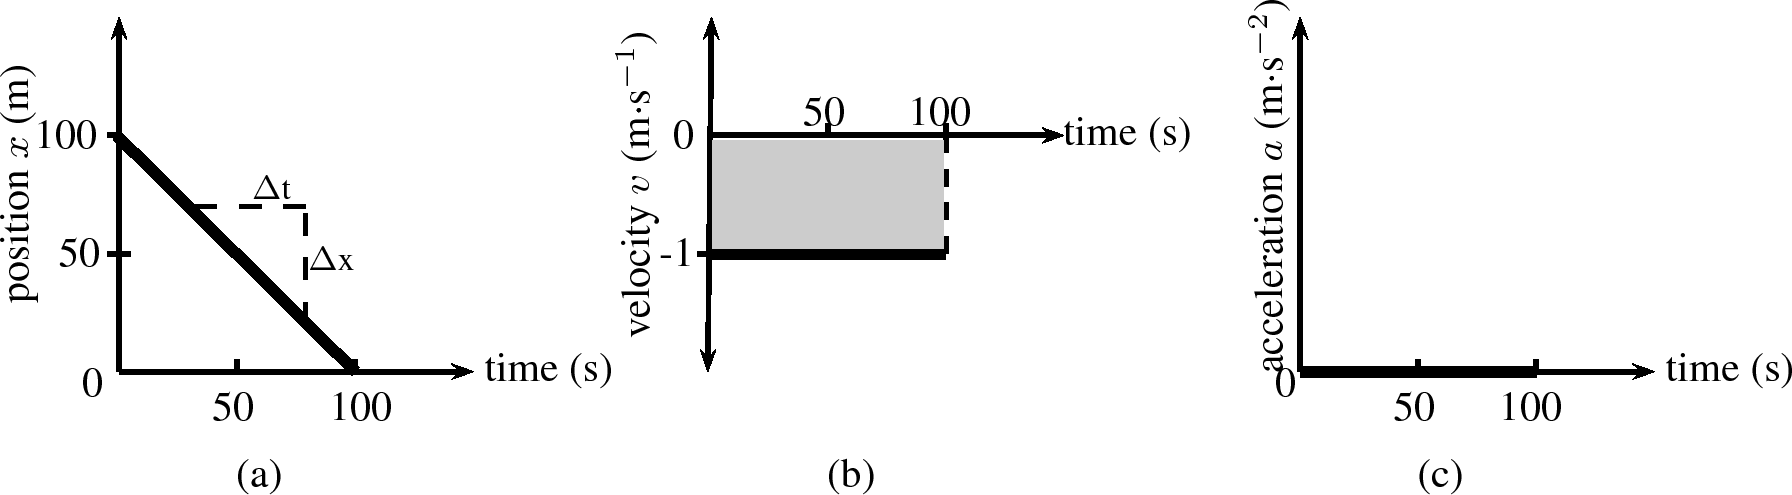
Graphs for motion at constant velocity (a) position vs. time (b) velocity vs. time (c) acceleration vs. time. The area of the shaded portion in the v vs. t graph corresponds to the object's displacement.

In the evening Lesedi walks 100 m from the bus stop to his house in 100 s . Assume that Lesedi's house is the origin. The following graphs can be drawn to describe the motion.

Graphs for motion with a constant negative velocity (a) position vs. time (b) velocity vs. time (c) acceleration vs. time. The area of the shaded portion in the v vs. t graph corresponds to the object's displacement.

We see that the v vs. t graph is a horisontal line. If the velocity vs. time graph is a horisontal line, it means that the velocity is constant (not changing). Motion at a constant velocity is known as uniform motion .

We can use the x vs. t to calculate the velocity by finding the gradient of the line.

v = Δ x Δ t = x f - x i t f - t i = 0 m - 100 m 100 s - 0 s = - 1 m · s - 1

Lesedi has a velocity of - 1 m · s - 1 , or 1 m · s - 1 towards his house. You will notice that the v  vs.  t graph is a horisontal line corresponding to a velocity of - 1 m · s - 1 . The horizontal line means that the velocity stays the same (remains constant) during the motion. This is uniform velocity.

We can use the v vs. t to calculate the acceleration by finding the gradient of the line.

a = Δ v Δ t = v f - v i t f - t i = 1 m · s - 1 - 1 m · s - 1 100 s - 0 s = 0 m · s - 2

Lesedi has an acceleration of 0 m · s - 2 . You will notice that the graph of a vs. t is a horisontal line corresponding to an acceleration value of 0 m · s - 2 . There is no acceleration during the motion because his velocity does not change.

We can use the v vs. t to calculate the displacement by finding the area under the graph.

v = Area under graph = × b = 100 × ( - 1 ) = - 100 m

This means that Lesedi has a displacement of 100 m towards his house.

Velocity and acceleration

  1. Use the graphs in [link] to calculate each of the following:
    1. Calculate Lesedi's velocity between 50 s and 100 s using the x vs. t graph. Hint: Find the gradient of the line.
    2. Calculate Lesedi's acceleration during the whole motion using the v vs. t graph.
    3. Calculate Lesedi's displacement during the whole motion using the v vs. t graph.
  2. Thandi takes 200 s to walk 100 m to the bus stop every morning. In the evening Thandi takes 200 s to walk 100 m from the bus stop to her home.
    1. Draw a graph of Thandi's position as a function of time for the morning (assuming that Thandi's home is the reference point). Use the gradient of the x vs. t graph to draw the graph of velocity vs. time. Use the gradient of the v vs. t graph to draw the graph of acceleration vs. time.
    2. Draw a graph of Thandi's position as a function of time for the evening (assuming that Thandi's home is the origin). Use the gradient of the x vs. t graph to draw the graph of velocity vs. time. Use the gradient of the v vs. t graph to draw the graph of acceleration vs. time.
    3. Discuss the differences between the two sets of graphs in questions 2 and 3.

Get Jobilize Job Search Mobile App in your pocket Now!

Get it on Google Play Download on the App Store Now


Source:  OpenStax, Siyavula textbooks: grade 10 physical science [caps]. OpenStax CNX. Sep 30, 2011 Download for free at http://cnx.org/content/col11305/1.7
Google Play and the Google Play logo are trademarks of Google Inc.

Notification Switch

Would you like to follow the 'Siyavula textbooks: grade 10 physical science [caps]' conversation and receive update notifications?

Ask