What happened in Britain and the rest of Europe about 200 to 250 years ago?
Factors that played a role in the movement of people from rural areas to towns and cities:
Because of agricultural technology fewer people were needed to work in fields to produce food.
Because of developments in medical technology, there was a greater increase in population growth and people moved to the cities where they expected more job opportunities.
Steam technology resulted in the building of factories (close to coal mines) and many of the home industries in the rural areas became redundant.
The cities offered a better working environment and better pay.
Activity 2:
To have a class discussion on urbanization in sa
[lo 1.1, 1.5, 2.1, 2.2, 2.3]
Talk to your parents about the situation in South Africa and have a class discussion afterwards about the patterns of urbanization in South Africa. Your teacher will guide you.
Particularly look for similarities and differences between Europe in the past, and present day South Africa. Write a short paragraph on the subject.
Interesting statistics relating to how rapidly urbanisation took place in Europe in the past:
Britain
1800 - 25% of the population lived in the cities and towns
1900 - 75% of the population lived in the cities and towns
The city of Milan in Italy
Between 1951 and 1956 the population of the city increased by 1,5 million! Seventy percent of the new inhabitants came from rural areas in Southern Italy.
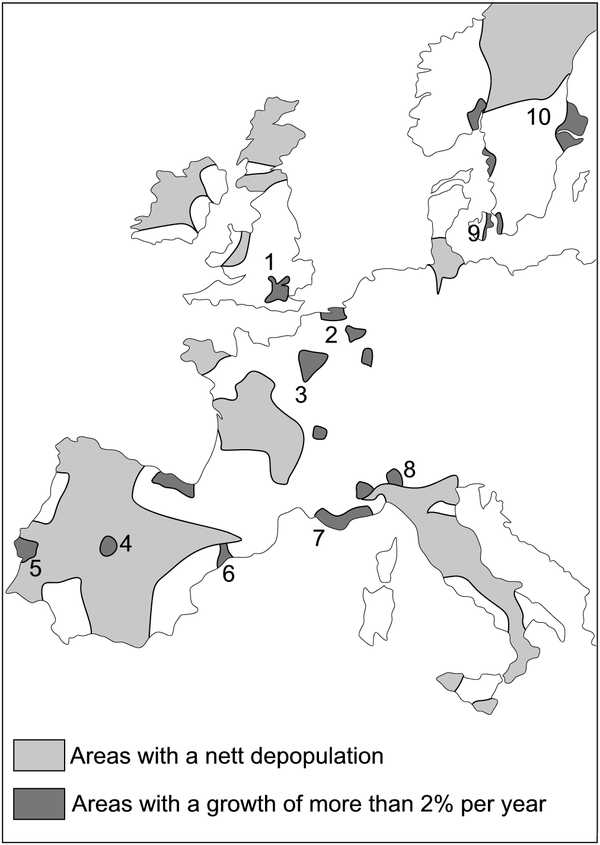
During the last 50 years there had been such a fixed pattern in population movement from rural to urban areas, especially in cities with rapidly developing industries, that rural areas were regarded as a source of labour for the industry. The depopulation of the countryside in areas such as northern Norway, the west of Ireland and northern Scotland was so severe, that it was difficult to refer to those areas as viable communities. The problem was made worse by the fact that the majority of people who moved were young and this slowed down the population growth even further.
Some countries have taken steps to rectify this situation. In Italy, for example, factories have been established in the south of the country.
3. Europe: change in the settlement of people over the past 50 years
Activity 3:
To identify urban areas in western europe
[lo 1.5]
This map shows the urban areas (indicated in black) in Western Europe to which people moved over the past 50 years. Do you realise where growth at a rate of 2% per year over a period of 50 years could lead? Identify the urban areas by placing the numbers alongside the cities.
Madrid
Barcelona
Milan
Stockholm
London
Rotterdam
Paris
Copenhagen
Marseilles
Lisbon
Activity 1.4 refers to
urban areas instead of
cities . In many instances this is due to expansion of cities. Eventually they merged with one another. The Ruhr region in Germany is one area in which a number of cities have merged. Those of you who are familiar with areas such as the Nelson Mandela Metropole, the area between Cape Town and Kuils River, the Witwatersrand or other metropoles in our country, will understand. In the Ruhr region and other European areas the high-density areas are much bigger.
Activity 4:
To reflect on the depopulation of rural areas and urbanisation
[lo 3.1, 3.3]
Is the influx of people into the cities a problem or an opportunity?
Is the depopulation of the rural areas a problem or an opportunity?
Your group must pretend to be the cabinet of this country. You need to make an urgent decision about the depopulation of the rural areas and the resulting influx into the cities. Are you going to oppose or allow it (and then manage it)?
Use the ideas in the frame below and propose other ideas, then discuss the issue thoroughly. Write a press release of about 150 to 200 words to announce your decision and motivate it.
* The prosperity of a country * Community life is disintegrating – What is left in rural areas? * Young people leave and older people are left behind * Churches * Schools * Houses * Controlled informal housing * Shops and garages * Technology * What does history teach us? * An enemy attack * Municipal income * The building of roads and provision of services * Employment opportunities * What role should the government play? * The “course of life” * Advantages and disadvantages * Tourism * The interest of the country * Emigration
Assessment
Learning Outcomes(LOs)
LO 1
GEOGRAPHICAL ENQUIRYThe learner will be able to use enquiry skills to investigate geographical and environmental concepts and processes.
Assessment standards(ASe)
We know this when the learner:
identifies sources of information, including simple statistics, to help answer the question about a social or environmental issue or problem;
selects and records relevant information from sources for specific purposes (including recording and observing in the field);
reports on enquiries, through discussion, debate, structured writing, graphs, tables, maps and diagrams.
LO 2
GEOGRAPHICAL KNOWLEDGE AND UNDERSTANDINGThe learner will be able to demonstrate an environmental knowledge and understanding.
We know this when the learner:
explains why more people live in some places than others;
identifies how access to different kinds of resources influences development in different places;
describes some ways in which society has changed the environment.
LO 3
EXPLORING ISSUESThe learner will be able to make informed decisions about social and environmental issues and problems.
We know this when the learner:
identifies inequalities within and between societies;
analyses some of the factors that lead toward social and environmental inequality at different geographical scales and in different places;
evaluates actions that lead to the sharing of resources and reducing poverty in a particular context.
Memorandum
Activity 1:
Climate – deserts
Frozen– very cold
Swamps en dangerous elements of nature
Diseases – causes large parts to be uninhabitable and therefore small population
Gateway to Europe
Nile – water source
Yes – most people concentrated around cities
Questions & Answers
differentiate between demand and supply
giving examples
In economics, a perfect market refers to a theoretical construct where all participants have perfect information, goods are homogenous, there are no barriers to entry or exit, and prices are determined solely by supply and demand. It's an idealized model used for analysis,
When MP₁ becomes negative, TP start to decline.
Extuples Suppose that the short-run production function of certain cut-flower firm is given by: Q=4KL-0.6K2 - 0.112 •
Where is quantity of cut flower produced, I is labour input and K is fixed capital input (K-5). Determine the average product of lab
Kelo
Extuples Suppose that the short-run production function of certain cut-flower firm is given by: Q=4KL-0.6K2 - 0.112 •
Where is quantity of cut flower produced, I is labour input and K is fixed capital input (K-5). Determine the average product of labour (APL) and marginal product of labour (MPL)
Quantity demanded refers to the specific amount of a good or service that consumers are willing and able to purchase at a give price and within a specific time period. Demand, on the other hand, is a broader concept that encompasses the entire relationship between price and quantity demanded
Ezea
ok
Shukri
how do you save a country economic situation when it's falling apart
Economic growth as an increase in the production and consumption of goods and services within an economy.but
Economic development as a broader concept that encompasses not only economic growth but also social & human well being.
Shukri
production function means
Jabir
What do you think is more important to focus on when considering inequality ?
sir...I just want to ask one question... Define the term contract curve? if you are free please help me to find this answer 🙏
Asui
it is a curve that we get after connecting the pareto optimal combinations of two consumers after their mutually beneficial trade offs
Awais
thank you so much 👍 sir
Asui
In economics, the contract curve refers to the set of points in an Edgeworth box diagram where both parties involved in a trade cannot be made better off without making one of them worse off. It represents the Pareto efficient allocations of goods between two individuals or entities, where neither p
Cornelius
In economics, the contract curve refers to the set of points in an Edgeworth box diagram where both parties involved in a trade cannot be made better off without making one of them worse off. It represents the Pareto efficient allocations of goods between two individuals or entities,
Cornelius
Suppose a consumer consuming two commodities X and Y has
The following utility function u=X0.4 Y0.6. If the price of the X and Y are 2 and 3 respectively and income Constraint is birr 50.
A,Calculate quantities of x and y which maximize utility.
B,Calculate value of Lagrange multiplier.
C,Calculate quantities of X and Y consumed with a given price.
D,alculate optimum level of output .
the market for lemon has 10 potential consumers, each having an individual demand curve p=101-10Qi, where p is price in dollar's per cup and Qi is the number of cups demanded per week by the i th consumer.Find the market demand curve using algebra. Draw an individual demand curve and the market dema
suppose the production function is given by ( L, K)=L¼K¾.assuming capital is fixed find APL and MPL. consider the following short run production function:Q=6L²-0.4L³ a) find the value of L that maximizes output b)find the value of L that maximizes marginal product