This module is from Elementary Algebra by Denny Burzynski and Wade Ellis, Jr.
In this chapter the student is shown how graphs provide information that is not always evident from the equation alone. The chapter begins by establishing the relationship between the variables in an equation, the number of coordinate axes necessary to construct its graph, and the spatial dimension of both the coordinate system and the graph. Interpretation of graphs is also emphasized throughout the chapter, beginning with the plotting of points. The slope formula is fully developed, progressing from verbal phrases to mathematical expressions. The expressions are then formed into an equation by explicitly stating that a ratio is a comparison of two quantities of the same type (e.g., distance, weight, or money). This approach benefits students who take future courses that use graphs to display information.The student is shown how to graph lines using the intercept method, the table method, and the slope-intercept method, as well as how to distinguish, by inspection, oblique and horizontal/vertical lines.
Objectives of this module: be familiar with the plane, know what is meant by the coordinates of a point, be able to plot points in the plane.
Overview
- The Plane
- Coordinates of a Point
- Plotting Points
The plane
Ordered pairs
We are now interested in studying graphs of linear equations in two variables. We know that solutions to equations in two variables consist of a pair of values, one value for each variable. We have called these pairs of values
ordered pairs. Since we have a pair of values to graph, we must have a pair of axes (number lines) upon which the values can be located.
Origin
We draw the axes so they are perpendicular to each other and so that they intersect each other at their
. This point is called the
origin.
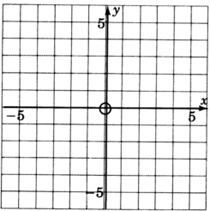
Rectangular coordinate system
These two lines form what is called a
rectangular coordinate system. They also determine a plane.
A
plane is a flat surface, and a result from geometry states that through any two intersecting lines (the axes) exactly one plane (flat surface) may be passed. If we are dealing with a linear equation in the two variables
and
, we sometimes say we are graphing the equation using a rectangular coordinate system, or that we are graphing the equation in the
.
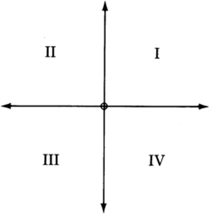
Quadrant
Notice that the two intersecting coordinate axes divide the plane into four equal regions. Since there are four regions, we call each one a
quadrant and number them counterclockwise using Roman numerals.
Recall that when we first studied the number line we observed the following:
For each real number there exists a unique point on the number line, and for each point on the number line we can associate a unique real number.
We have a similar situation for the plane.
For each ordered pair
, there exists a unique point in the plane, and to each point in the plane we can associate a unique ordered pair
of real numbers.
Coordinates of a point
Coordinates of a point
The numbers in an ordered pair that are associated with a particular point are called the
coordinates of the point. The
first number in the ordered pair expresses the point’s horizontal distance and direction (left or right) from the origin. The
second number expresses the point’s vertical distance and direction (up or down) from the origin.


