<< Chapter < Page Chapter >> Page >

The normal and binormal vectors

We have seen that the derivative r ( t ) of a vector-valued function is a tangent vector to the curve defined by r ( t ) , and the unit tangent vector T ( t ) can be calculated by dividing r ( t ) by its magnitude. When studying motion in three dimensions, two other vectors are useful in describing the motion of a particle along a path in space: the principal unit normal vector    and the binormal vector    .

Definition

Let C be a three-dimensional smooth    curve represented by r over an open interval I. If T ( t ) 0 , then the principal unit normal vector at t is defined to be

N ( t ) = T ( t ) T ( t ) .

The binormal vector at t is defined as

B ( t ) = T ( t ) × N ( t ) ,

where T ( t ) is the unit tangent vector.

Note that, by definition, the binormal vector is orthogonal to both the unit tangent vector and the normal vector. Furthermore, B ( t ) is always a unit vector. This can be shown using the formula for the magnitude of a cross product

B ( t ) = T ( t ) × N ( t ) = T ( t ) N ( t ) sin θ ,

where θ is the angle between T ( t ) and N ( t ) . Since N ( t ) is the derivative of a unit vector, property (vii) of the derivative of a vector-valued function tells us that T ( t ) and N ( t ) are orthogonal to each other, so θ = π / 2 . Furthermore, they are both unit vectors, so their magnitude is 1. Therefore, T ( t ) N ( t ) sin θ = ( 1 ) ( 1 ) sin ( π / 2 ) = 1 and B ( t ) is a unit vector.

The principal unit normal vector can be challenging to calculate because the unit tangent vector involves a quotient, and this quotient often has a square root in the denominator. In the three-dimensional case, finding the cross product of the unit tangent vector and the unit normal vector can be even more cumbersome. Fortunately, we have alternative formulas for finding these two vectors, and they are presented in Motion in Space .

Finding the principal unit normal vector and binormal vector

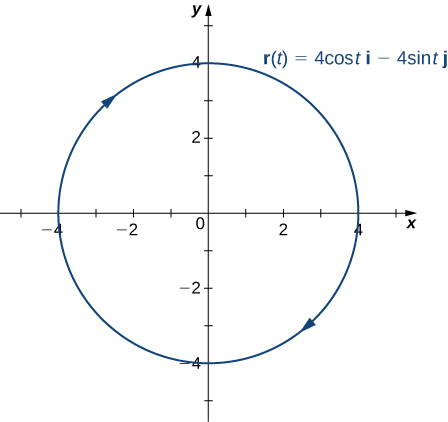
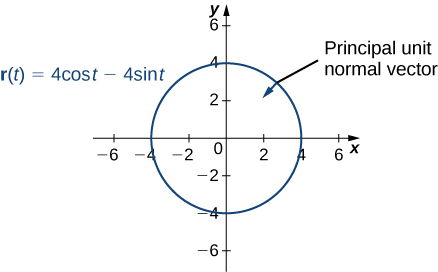
For each of the following vector-valued functions, find the principal unit normal vector. Then, if possible, find the binormal vector.

  1. r ( t ) = 4 cos t i 4 sin t j
  2. r ( t ) = ( 6 t + 2 ) i + 5 t 2 j 8 t k
  1. This function describes a circle.
    This figure is the graph of a circle centered at the origin with radius of 2. The orientation of the circle is clockwise. It represents the vector-valued function r(t) = 4costi – 4 sintj.
    To find the principal unit normal vector, we first must find the unit tangent vector T ( t ) :
    T ( t ) = r ( t ) r ( t ) = −4 sin t i 4 cos t j ( −4 sin t ) 2 + ( −4 cos t ) 2 = −4 sin t i 4 cos t j 16 sin 2 t + 16 cos 2 t = −4 sin t i 4 cos t j 16 ( sin 2 t + cos 2 t ) = −4 sin t i 4 cos t j 4 = sin t i cos t j .

    Next, we use [link] :
    N ( t ) = T ( t ) T ( t ) = cos t i + sin t j ( cos t ) 2 + ( sin t ) 2 = cos t i + sin t j cos 2 t + sin 2 t = cos t i + sin t j .

    Notice that the unit tangent vector and the principal unit normal vector are orthogonal to each other for all values of t :
    T ( t ) · N ( t ) = sin t , cos t · cos t , sin t = sin t cos t cos t sin t = 0.

    Furthermore, the principal unit normal vector points toward the center of the circle from every point on the circle. Since r ( t ) defines a curve in two dimensions, we cannot calculate the binormal vector.
    This figure is the graph of a circle centered at the origin with radius of 2. The orientation of the circle is clockwise. It represents the vector-valued function r(t) = 4costi – 4 sintj. On the circle in the first quadrant is a vector pointing inward. It is labeled “principal unit normal vector”.
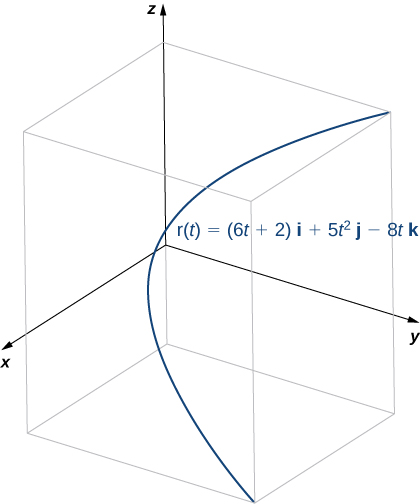
  2. This function looks like this:
    This figure is a curve in 3 dimensions. It is inside of a box. The box represents the first octant. The curve starts at the bottom right of the box and curves through the box in a parabolic curve to the top.
    To find the principal unit normal vector, we first find the unit tangent vector T ( t ) :
    T ( t ) = r ( t ) r ( t ) = 6 i + 10 t j 8 k 6 2 + ( 10 t ) 2 + ( −8 ) 2 = 6 i + 10 t j 8 k 36 + 100 t 2 + 64 = 6 i + 10 t j 8 k 100 ( t 2 + 1 ) = 3 i 5 t j 4 k 5 t 2 + 1 = 3 5 ( t 2 + 1 ) 1 / 2 i t ( t 2 + 1 ) 1 / 2 j 4 5 ( t 2 + 1 ) 1 / 2 k .

    Next, we calculate T ( t ) and T ( t ) :
    T ( t ) = 3 5 ( 1 2 ) ( t 2 + 1 ) 3 / 2 ( 2 t ) i ( ( t 2 + 1 ) 1 / 2 t ( 1 2 ) ( t 2 + 1 ) 3 / 2 ( 2 t ) ) j 4 5 ( 1 2 ) ( t 2 + 1 ) 3 / 2 ( 2 t ) k = 3 t 5 ( t 2 + 1 ) 3 / 2 i 1 ( t 2 + 1 ) 3 / 2 j + 4 t 5 ( t 2 + 1 ) 3 / 2 k T ( t ) = ( 3 t 5 ( t 2 + 1 ) 3 / 2 ) 2 + ( 1 ( t 2 + 1 ) 3 / 2 ) 2 + ( 4 t 5 ( t 2 + 1 ) 3 / 2 ) 2 = 9 t 2 25 ( t 2 + 1 ) 3 + 1 ( t 2 + 1 ) 3 + 16 t 2 25 ( t 2 + 1 ) 3 = 25 t 2 + 25 25 ( t 2 + 1 ) 3 = 1 ( t 2 + 1 ) 2 = 1 t 2 + 1 .

    Therefore, according to [link] :
    N ( t ) = T ( t ) T ( t ) = ( 3 t 5 ( t 2 + 1 ) 3 / 2 i 1 ( t 2 + 1 ) 3 / 2 j + 4 t 5 ( t 2 + 1 ) 3 / 2 k ) ( t 2 + 1 ) = 3 t 5 ( t 2 + 1 ) 1 / 2 i 5 5 ( t 2 + 1 ) 1 / 2 j + 4 t 5 ( t 2 + 1 ) 1 / 2 k = 3 t i + 5 j 4 t k 5 t 2 + 1 .

    Once again, the unit tangent vector and the principal unit normal vector are orthogonal to each other for all values of t :
    T ( t ) · N ( t ) = ( 3 i 5 t j 4 k 5 t 2 + 1 ) · ( 3 t i + 5 j 4 t k 5 t 2 + 1 ) = 3 ( −3 t ) 5 t ( −5 ) 4 ( 4 t ) 5 t 2 + 1 = −9 t + 25 t 16 t 5 t 2 + 1 = 0.

    Last, since r ( t ) represents a three-dimensional curve, we can calculate the binormal vector using [link] :
    B ( t ) = T ( t ) × N ( t ) = | i j k 3 5 t 2 + 1 5 t 5 t 2 + 1 4 5 t 2 + 1 3 t 5 t 2 + 1 5 5 t 2 + 1 4 t 5 t 2 + 1 | = ( ( 5 t 5 t 2 + 1 ) ( 4 t 5 t 2 + 1 ) ( 4 5 t 2 + 1 ) ( 5 5 t 2 + 1 ) ) i ( ( 3 5 t 2 + 1 ) ( 4 t 5 t 2 + 1 ) ( 4 5 t 2 + 1 ) ( 3 t 5 t 2 + 1 ) ) j + ( ( 3 5 t 2 + 1 ) ( 5 5 t 2 + 1 ) ( 5 t 5 t 2 + 1 ) ( 3 t 5 t 2 + 1 ) ) k = ( −20 t 2 20 25 ( t 2 + 1 ) ) i + ( −15 15 t 2 25 ( t 2 + 1 ) ) k = −20 ( t 2 + 1 25 ( t 2 + 1 ) ) i 15 ( t 2 + 1 25 ( t 2 + 1 ) ) k = 4 5 i 3 5 k .
Got questions? Get instant answers now!

Questions & Answers

how do you get the 2/50
Abba Reply
number of sport play by 50 student construct discrete data
Aminu Reply
width of the frangebany leaves on how to write a introduction
Theresa Reply
Solve the mean of variance
Veronica Reply
Step 1: Find the mean. To find the mean, add up all the scores, then divide them by the number of scores. ... Step 2: Find each score's deviation from the mean. ... Step 3: Square each deviation from the mean. ... Step 4: Find the sum of squares. ... Step 5: Divide the sum of squares by n – 1 or N.
kenneth
what is error
Yakuba Reply
Is mistake done to something
Vutshila
Hy
anas
hy
What is the life teble
anas
hy
Jibrin
statistics is the analyzing of data
Tajudeen Reply
what is statics?
Zelalem Reply
how do you calculate mean
Gloria Reply
diveving the sum if all values
Shaynaynay
let A1,A2 and A3 events be independent,show that (A1)^c, (A2)^c and (A3)^c are independent?
Fisaye Reply
what is statistics
Akhisani Reply
data collected all over the world
Shaynaynay
construct a less than and more than table
Imad Reply
The sample of 16 students is taken. The average age in the sample was 22 years with astandard deviation of 6 years. Construct a 95% confidence interval for the age of the population.
Aschalew Reply
Bhartdarshan' is an internet-based travel agency wherein customer can see videos of the cities they plant to visit. The number of hits daily is a normally distributed random variable with a mean of 10,000 and a standard deviation of 2,400 a. what is the probability of getting more than 12,000 hits? b. what is the probability of getting fewer than 9,000 hits?
Akshay Reply
Bhartdarshan'is an internet-based travel agency wherein customer can see videos of the cities they plan to visit. The number of hits daily is a normally distributed random variable with a mean of 10,000 and a standard deviation of 2,400. a. What is the probability of getting more than 12,000 hits
Akshay
1
Bright
Sorry i want to learn more about this question
Bright
Someone help
Bright
a= 0.20233 b=0.3384
Sufiyan
a
Shaynaynay
How do I interpret level of significance?
Mohd Reply
It depends on your business problem or in Machine Learning you could use ROC- AUC cruve to decide the threshold value
Shivam
how skewness and kurtosis are used in statistics
Owen Reply
yes what is it
Taneeya
Got questions? Join the online conversation and get instant answers!
Jobilize.com Reply

Get Jobilize Job Search Mobile App in your pocket Now!

Get it on Google Play Download on the App Store Now


Source:  OpenStax, Calculus volume 3. OpenStax CNX. Feb 05, 2016 Download for free at http://legacy.cnx.org/content/col11966/1.2
Google Play and the Google Play logo are trademarks of Google Inc.

Notification Switch

Would you like to follow the 'Calculus volume 3' conversation and receive update notifications?

Ask