

| << Chapter < Page | Chapter >> Page > |
Regardless of the fact that the real and imaginary parts are not flat, the square root of the sum of the squares of the real and imaginary parts (the amplitude) should be the same for every point in wavenumber space for this case. Thus, the real and imaginary parts are related in a very special way.
The code that is executed when switchCase equals 1 is shown in Listing 16 .
| Listing 16. Code for Case 1. |
|---|
case 1:
spatialData[2][2] = 1;break; |
This case places a single impulse close to but not at the origin in space. This produces a flat amplitude spectrum in wavenumber space just like in Case 0.However, the real and imaginary parts of the spectrum are different from Case 0. They are not flat. The computations are probably more subject to errors in thiscase than for Case 0.
Figure 6 shows the six output images produced by the program for a switchCase value of 1.
| Figure 6. A displaced impulse in space. |
|---|
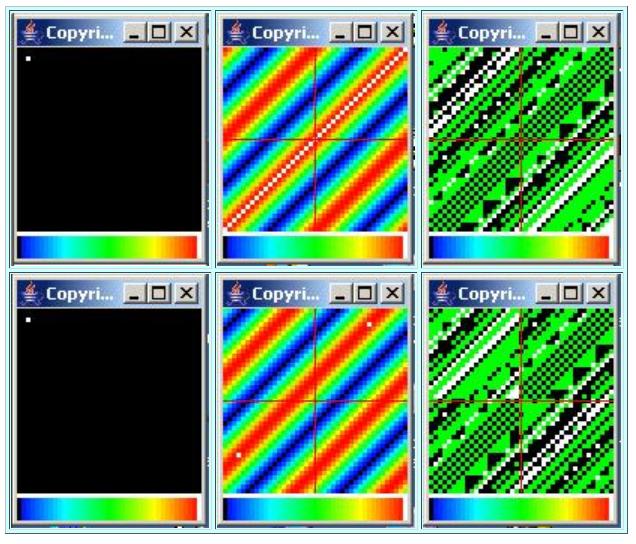 |
The input and output surfaces showing the single impulse are in the two leftmost images in Figure 6 . From a visual viewpoint, the output at the bottom appears to be an exact match for the input at the top.
The real and imaginary parts of the wavenumber spectrum are shown in the two center images. The real part is at the top and the imaginary part is at thebottom.
For a single impulse in the space domain, we would expect each of these surfaces to be a 3D sinusoidal wave (similar to a piece of corrugated sheet metal) . That appears to be what we are seeing, with almost two full cycles of the sinusoidal wave between the origin and the bottom right corner of theimage.
(The distance between the peaks in the sinusoidal wave in wavenumber space is inversely proportional to the distance of the impulse from theorigin in space. Hence, as the impulse approaches the origin in space, the peaks in wavenumber space become further and further apart. When the impulseis located at the origin in space, the distance between the peaks in wavenumber space becomes infinite, leading to flat real and imaginaryparts.)
We know that the real part of a wavenumber spectrum resulting from the Fourier transform of a real space function is symmetric about the origin. Wealso know that the imaginary part is asymmetric about the origin.
The symmetry/asymmetry requirements appear to be satisfied by this case. The color bands in the real part at the top are symmetric on either side of theorigin.
The imaginary part is asymmetric about the origin (the centers of the red/white and the blue/black bands appear to be equidistant from and on oppositesides of the origin) .
The amplitude spectrum is shown in the two rightmost images in Figure 6 . The unshifted amplitude spectrum is shown at the top. The amplitude spectrum withthe origin shifted to the center is shown at the bottom.
The ugliness of these two plots is an artifact of the 3D plotting scheme implemented by the class named ImgMod29 . In order to maximize the use of the available dynamic range in the plot, eachsurface that is plotted is normalized such that:
Notification Switch
Would you like to follow the 'Digital signal processing - dsp' conversation and receive update notifications?

|
|

|
|

|
|

|
|
|
|
|

|
|

|
|

|
|
|
|
|

|