

| << Chapter < Page | Chapter >> Page > |
The final step in the project was to test the algorithm we had created so we went ahead and conducted a series of tests that would evaluate mostly correctness but also, to some extent, performance.
First, we wanted to test to make sure that our algorithm was working properly. To do this, we attempted to match short segments of the original song (i.e. “noiseless”, actual copies of the library songs) of approximately ten seconds in length. The table below shows how these original clips matched. The titles from left to right are song segments, and titles running from top to bottom are library songs. We abbreviated them from the original, so they would fit in the matrix. The original names are “Stop this Train”, by John Mayer, “Semi-Charmed Life”, by Third Eye Blind, “I’ve got a Feeling” by Black Eyed Peas, “Love Like Rockets”, by Angels and Airwaves, “Crash Into Me”, by Dave Matthews Band and “Just Another Day in Paradise”, by Phil Vassar.
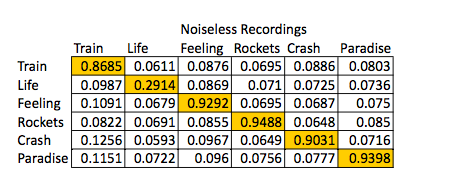
The clear matches with highest scores can be seen along the diagonal. Most of these are close to 1, and each match meets our criteria of being 1.5 times greater than the other scores (comparing horizontally.) This was a good test that we were able to use to modify our algorithm and try different techniques. Ultimately, the above results showed that our code was sufficient for our needs.
We then needed to see if our code actually worked with real world (noisy) song segments. Songs were recorded on an iPhone simultaneously with various types of noise as follows: Train- low volume talking, Life- loud recording (clipping), Crash- typing, Rockets- repeating computer error noise, Feeling- Gaussian noise (added in Matlab to wav file), and Paradise- very loud talking. There were two additional songs we used in this test to check for robustness and proper matching. One is a live version of Crash, which includes a lot of crowd noise but does not necessarily have all the identical features of the original Crash fingerprint. The other additional song, “Yellow”, by Coldplay, is a song that is not in our library at all.
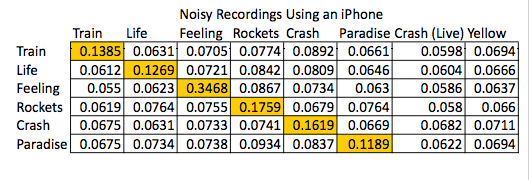
Again, the clear matches are highlighted in yellow along the diagonal. The above results show that our algorithm can still accurately match the song segments in more realistic conditions. The graph below shows more interesting results.
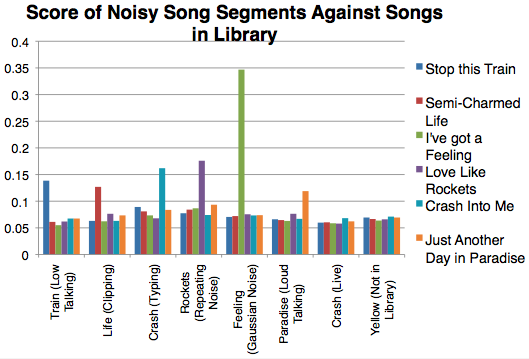
As before, the matches in the first six songs (from left to right) are obvious, and Yellow does not show any clear correlation to any library song, as desired, but the live version of Crash presents an interesting question. Do we actually want this song to match? Since we wanted our fingerprinting method to be unique to each song and song segment, we decided it would be best to have a non-match in this scenario. However, if one observes closely, it can be seen that the closest match (though it is definitely not above the 1.5 mark) is, in fact, matching to the original Crash. This emerges as a small feature of our results. This small “match” says that although we may not match any songs in the library, we can tell you that this live version most resembles the original Crash version, which may be a desirable outcome if we were to market this project.
We were amazed that the final filter could perform so well. The idea of completely ignoring amplitude information in the filter came from the paper by Avery Li-Chun Wang, one of Shazam’s developers. As he mentions, discarding amplitude information makes the algorithm more insensitive to equalization. However, this approach also makes it more noise resistant since, since what we do from there on basically consists of counting matching peaks versus non-matching peaks. Any leftover noise will count very little towards the final score, as the number of peaks per area in the spectrogram is limited by the thresholding algorithm and all peaks have the same magnitude in the filter.
Notification Switch
Would you like to follow the 'Digital song analysis using frequency analysis' conversation and receive update notifications?

|
|

|
|

|
|

|
|

|
|

|
|

|
|

|
|

|
|

|