

| << Chapter < Page | Chapter >> Page > |
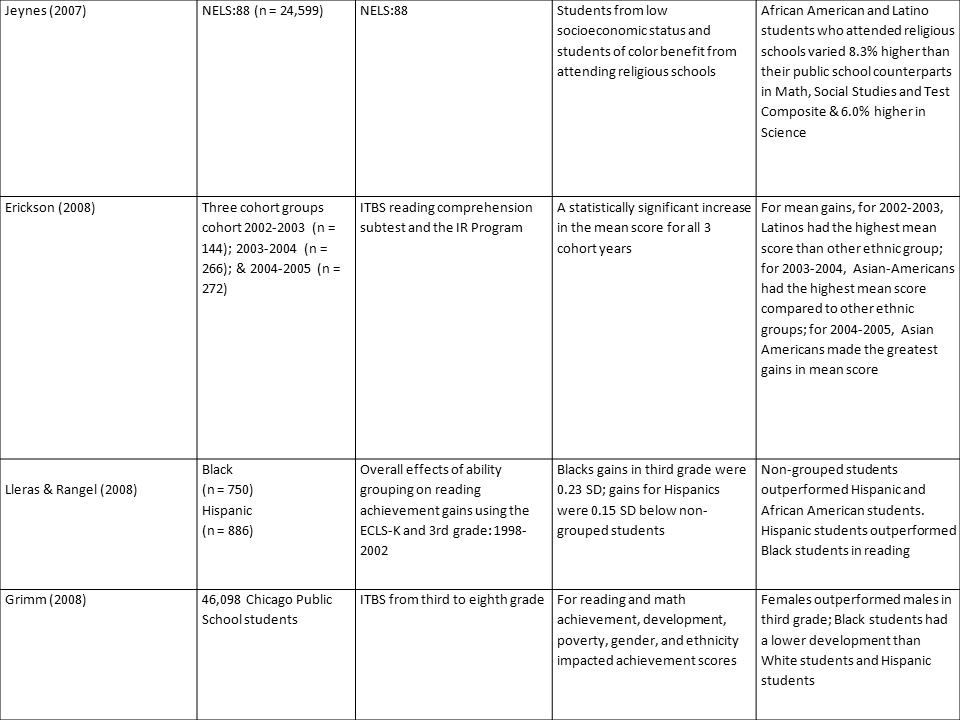
Grimm (2008) analyzed the relationship between developmental reading in early elementary and math achievement among students who were either White or non-White. The Iowa Test of Basic Skills from third to eighth grade was used as the dependent variable to act as a predictor of growth and progress in math. Results of the analysis revealed that Black males demonstrated slower developmental reading rate, which affected their math achievement in problem solving and data interpretation. Hispanic and Black males demonstrated delayed changes in reading development and showed slower proficiency in mathematical computations. Finally, for mathematical concepts and estimations, Hispanic and Black males demonstrated prolonged rates of development in reading, which delayed progress in math achievement in later grades.
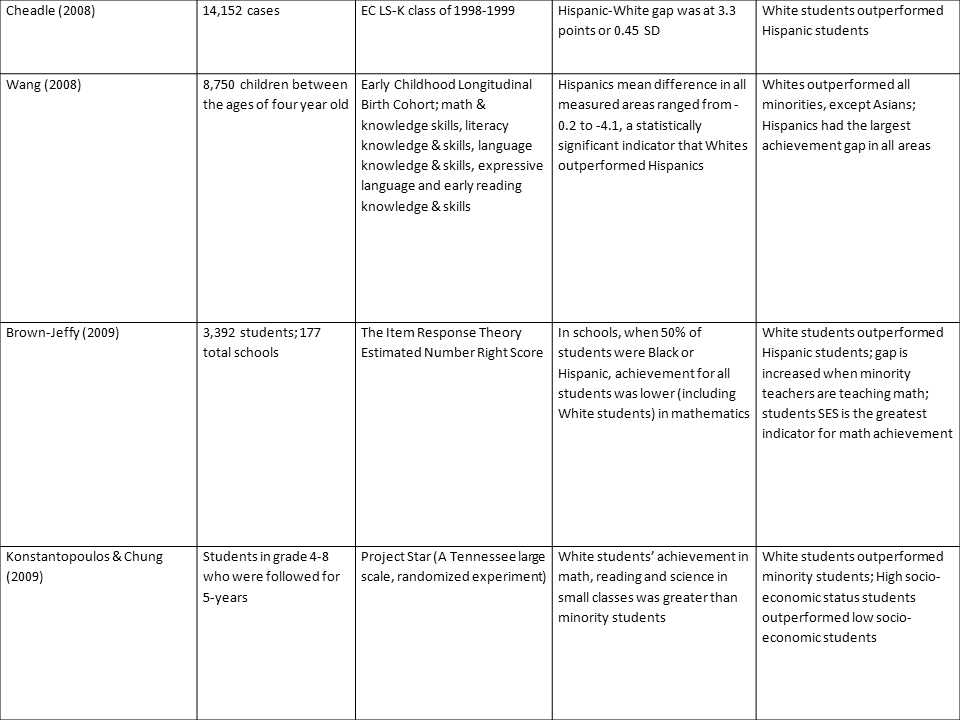
An analysis of data from the Early Childhood Longitudinal Study (Kindergarten cohort, 1998-1999) demonstrated differences for math achievement between White and minority students (i.e., Asian-American, Black, and Hispanic) (Cheadle, 2008). In relation to the achievement gap between Black and White students, Black students entered kindergarten with a 0.34 SD or 2.5 points lower than their White counterparts. Similarly, a Hispanic-White achievement gap of 0.45 SD or 3.3 points lower than White students and 0.8 points lower than Black students was present. In contrast, Asian-American and White students did not have a statistically significant difference in achievement upon entering kindergarten.
Achievement gaps between White students and minority children are evident even before children enter their first day of school. Wang (2008) examined data on 4-year old children who participated in the Early Childhood Longitudinal Study-Birth Cohort (ECLS-B) and how minority children compared to White children in the following areas: language knowledge and skills, literacy knowledge and skills, and mathematics knowledge and skills. Mean differences for all areas were statistically significant. White students outperformed Hispanic students and Black students. Hispanic 4-year old students had the highest achievement gap compared to White students in overall math, literacy language knowledge, literacy and fine motor skills. Asian children scored higher than White students in all areas, with the exception of reflective vocabulary knowledge and skills.
Brown-Jeffy (2009) investigated the race gap and its influence on math achievement between minority and non-minority students. Using the High School Effectiveness Study data of over 3,000 students, Brown-Jeffy concluded that when half of the students in public schools were Hispanic or Black, all students, including White, in the school have lower academic achievement. Schools with over 30% to 49% of students who were Hispanic or Black had an “egalitarian” academic achievement between Hispanic students and White students (Brown-Jeffy, 2009, p. 388).
Konstantopoulous and Chung (2009) evaluated long-term effects of small classes in relation to students and academic achievement gaps. They examined data from Project STAR and the Lasting Benefits Study, in math, reading and science scores. Konstantopoulous and Chung (2009) concluded that students benefited greatest from small classes in later grades. Higher grades and smaller achievement gaps were produced the earlier the student was enrolled in small classes.
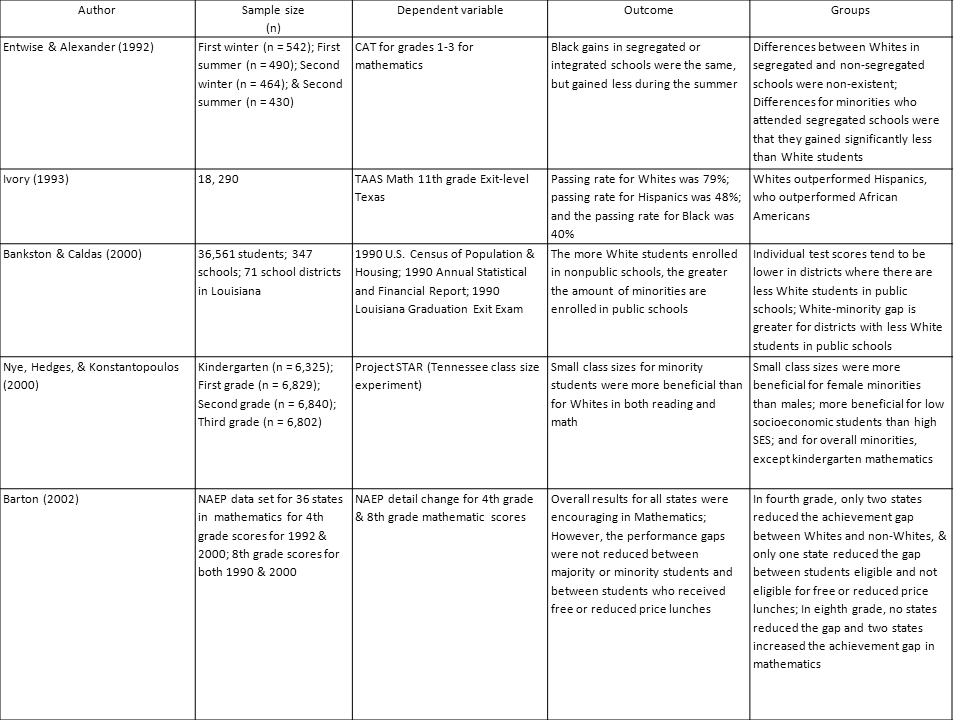
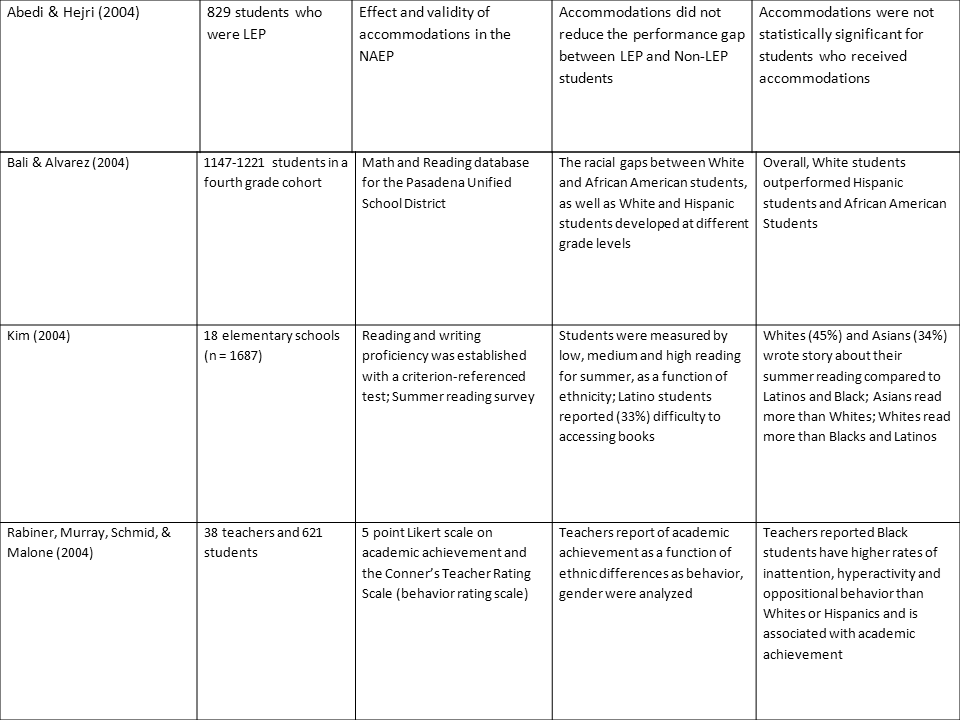
Analyses of data are summarized in the following table. Readers are referred to Table 1 for a summary of quantitative articles pertaining to achievement gaps among White and non-White groups.

Discussed in this conceptual analysis were the results of numerous studies in which the achievement gap and related variables were analyzed. Educational equity in elementary schools, in particular, where the educational process begins for all students was discussed. Also demonstrated was the continued presence of an achievement gap among Whites, non-Whites, and students with a label of Limited English Proficient, regardless of the accountability mandated by the NCLB Act. Researchers who analyzed data from pre-kindergarten through high school have repeatedly documented the academic achievement discrepancies between and among White, non-White, and students with a label of Limited English Proficient. Regardless of additional money, resources, and qualified personnel, minority studies are performing much more poorly than their White counterparts. We hope that, through this article, we have provided an overview of the empirical research in a way that will assist policy makers, administrators, and educators in making cognizant resolutions regarding the minimization of the achievement gap.
Due to the size and number of references, the Editors have chosen to display as a PDF to maintain the original format of the authors. Click here to access the The Reference Section.
Notification Switch
Would you like to follow the 'The achievement gap between white and non-white students' conversation and receive update notifications?

|
|

|
|

|
|

|
|

|
|

|
|

|
|

|
|

|
|

|