-
Copy skewness and kurtosis information into the skewness and kurtosis calculator

Step two:
-
Compute Descriptive Statistics on the Dependent Variable
- * Do so via the ANOVA procedure.
- * Note. Do not use the ANOVA statistical significance information provided in the output. Use only the
M s,
SD s, and
n s.
- *
The screen shot will occur in the next step (Mean and standard deviation)
Step three:
-
Run Nonparametric One-Way ANOVA on Data
- * Analyze
- * Nonparametric Tests
- *
k Independent Samples

- * Keep the default of Kruskal-Wallis
H
checked
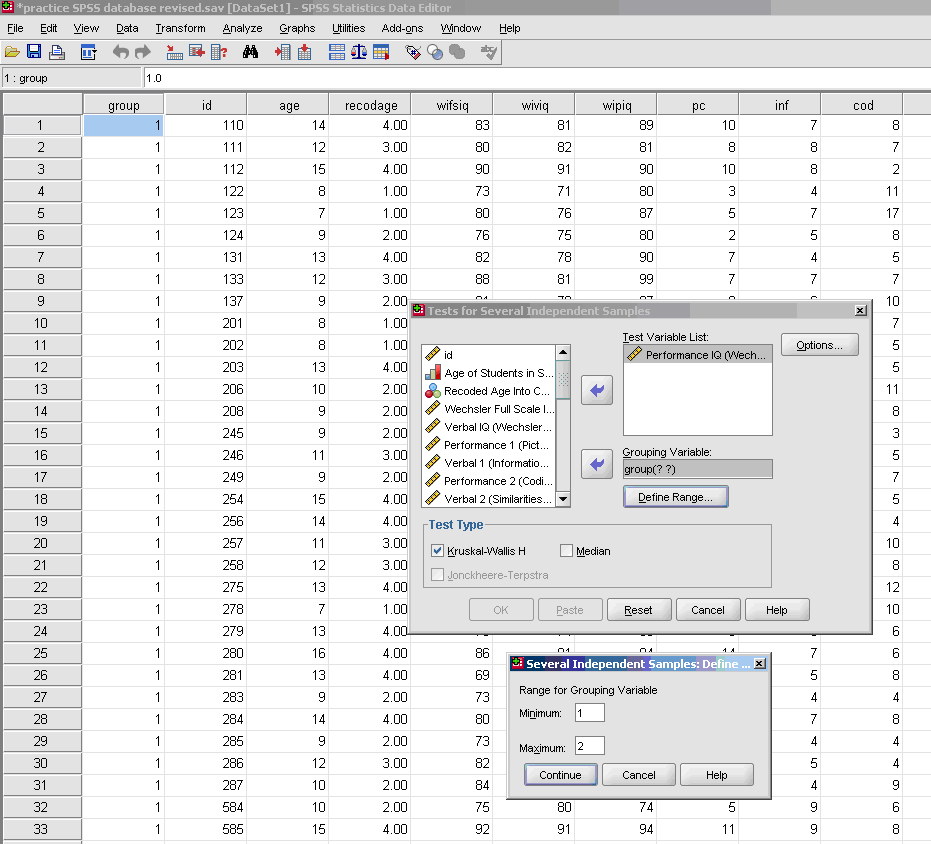
- * Test Variable would be your Dependent Variable (e.g., test scores)
- * Grouping Variable would be your Independent Variable (categories)
- * Define Groups
- * Insert the number for your lowest numbered group and then the number for your highest numbered group.
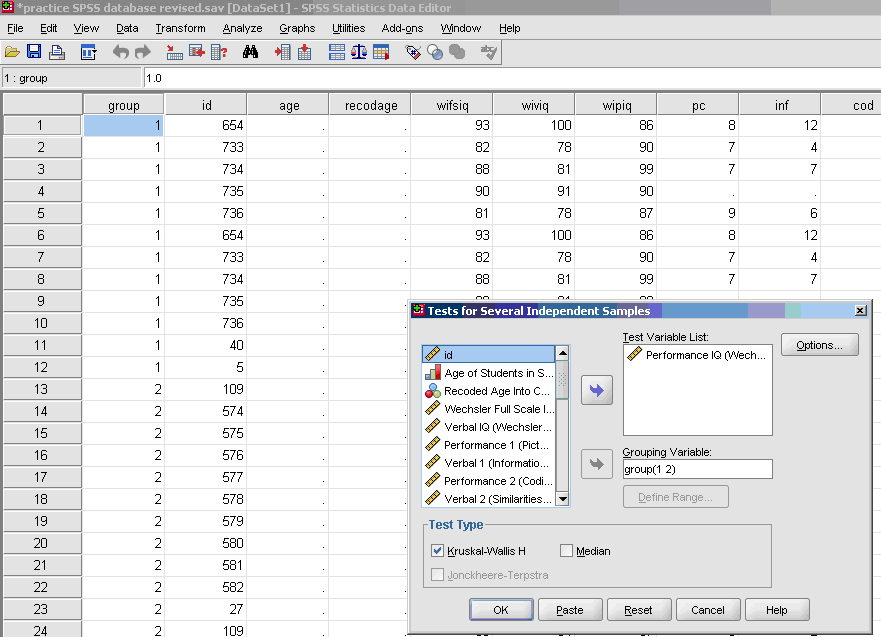
- Note: Click on view than value labels to find the code for each group.
- * Continue
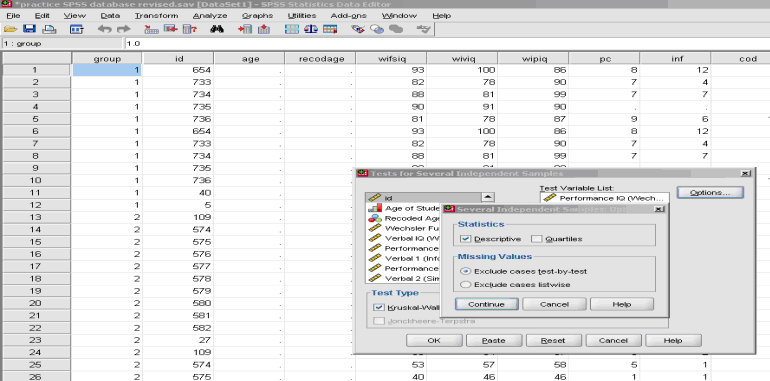
- ** To obtain the Means and Standard Deviation:
- * Click on options
- * Highlight Descriptive
- * Click Continue
Step four:
-
Check for Statistical Significance
-
Numerical sentence is written as :
Χ
2
= 430.66,
p <.001
Test statistics
a,b
|
Performance IQ (Wechsler Performance Intelligence 3) |
| Chi-Square |
430.661 |
| df |
1 |
|
Asymp. Sig. |
.000 |
- a. Kruskal Wallis Test
- b. Grouping Variable: Disability Group Membership
Step five:
If you have a statistically significant finding in your nonparametric ANOVA, you need to run the appropriate nonparametric post hocs. Refer to your steps on running the nonparametric independent samples
t -test.
Step six:
-
Calculate Nonparametric Independent Samples
t
-test on Data
- √ Analyze
- √ Nonparametric Tests
- √ 2 Independent Samples
- √ Test Variable would be your Dependent Variable (e.g., test scores)
- √ Grouping Variable would be your dichotomous Independent Variable
- √ Define Groups
- √ Group One is No. 1 and Group Two is No. 2 (or whatever numbers you used to identify each group)
- Note: Click on view then value lables to find the code for each group
- √ Continue
- √ OK
- Note. The above procedure is repeated for each pairwise comparison. Thus, if you have three groups, you would have three calculations. Correct for inflated error by using the Bonferroni method of adjustment. Take the number of pairwise comparisons you are calculating and divide .05 by that.
-
Check for Statistical Significance
- 1. Go to the Test Statistics Box and look at the cell in the bottom right column to check for statistical significance.
- If you have any value less than .05 then you have statistical significance. Remember to replace the third zero with a 1, if the value is .000 (i.e., for a sig value of .000, thus it would read .001).
Test statistics
a
|
Performance IQ (Wechsler Performance Intelligence 3) |
| Mann-Whitney U |
6765.500 |
| Wilcoxon W |
44166.500 |
| Z |
-20.752 |
|
Asymp. Sig. (2-tailed) |
.000 |
- a. Grouping Variable: Disability Group Membership
To determine how to report the results of these nonparametric followup procedures, see the chapter on nonparametric independent samples
t -test in this book.
Writing up your nonparamteric anova
So, how do you "write up" your Research Questions and your Results? Schuler W. Huck (2000) in his seminal book entitled,
Reading Statistics and Research, points to the importance of your audience understanding and making sense of your research in written form. Huck further states:
This book is designed to help people
decipher what researchers are trying to communicate in the written or oral summaries of their investigations. Here, the goal is simply to distill meaning from the words, symbols, tables, and figures included in the research report. To be competent in this arena, one must not only be able to decipher what's presented but also to "fill in the holes"; this is the case because researchers typically assume that those receiving the research report are familiar with unmentioned details of the research process and statistical treatment of data.
A Note from the Editors
Researchers and Professors John Slate and Ana Rojas-LeBouef understand this critical issue, so often neglected or not addressed by other authors and researchers. They point to the importance of doctoral students "writing up their statistics" in a way that others can understand your reporting and as importantly, interpret the meaning of your significant findings and implications for the preparation and practice of educational leadership. Slate and LeBouef provide you with a model for "writing up your Nonparametric ANOVA statistics."
Click here to view:
Writing Up Your Nonparametric ANOVA Statistics
References
- Cohen, J. (1988).
Statistical power analysis for the behavioral sciences (2nd ed.)
. Hillsdale, NJ: Lawrence Erbaum
- Hyperstats Online Statistics Textbook. (n.d.) Retrieved from
(External Link)
- Kurtosis. (n.d.). Definition. Retrieved from
(External Link)&term_id=326
- Kurtosis. (n.d.).
Definition of normality . Retrieved from
(External Link)
- Onwuegbuzie, A. J.,&Daniel, L. G. (2002). Uses and misuses of the correlation coefficient.
Research in the Schools, 9 (1)
, 73-90.
- Skewness. (n.d.) Retrieved from
(External Link)&term_id=356
- Skewness. (n.d.).
Definition of normality . Retrieved from
(External Link)
- StatSoft, Inc. (2011).
Electronic statistics textbook. Tulsa, OK: StatSoft. WEB:
(External Link)


