

| << Chapter < Page | Chapter >> Page > |
(The color black could also be dedicated to identifying the lowest elevation in the design of the Color Contour plot, in which case, bothschemes would be equal in this regard.)
As we learned earlier, the lowest elevation occurs at four different points on the surface, and those points are near the corners.
Both plots show that while the valleys between the central and minor peaks are very deep, they aren't quite as deep as the lowest elevation. They are bluein the Color Shift plot and gray in the Color Contour plot. Because the gray color represents a somewhat smaller elevation range in the Color Contour plotthan the blue represents in the Color Shift plot, the elevation of the valley is defined more accurately in the Color Contour plot.
Sometimes when plotting data, it is useful to plot the logarithm of the data values instead of the raw values.
(For many years, engineers have plotted data on graph paper referred to either as semi-log paper or log-log paper. Each type of graph paper hasadvantages and disadvantages relative to the other type and also has advantages and disadvantages relative to linear graph paper. This programprovides a capability that is analogous to the use of semi-log paper but in a 3D sense.)
The use of semi-log paper has the effect of flattening the plot in the 2D case, or flattening the surface in the 3D case. The semi-log approach tends topull the structure of the low-level values up so that they can be better observed. The logarithm of the low elevations is closer to the maximum elevationthan is the raw value of the low elevations.
The three images in the top row of Figure 2 are reproductions of the three images in Figure 1 . They were included in Figure 2 for comparison with the bottom three images in Figure 2 .
| Figure 2 . Sample output with logarithmic flattening. |
|---|
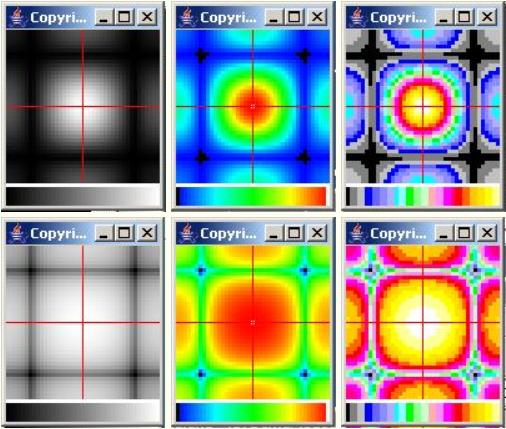 |
The bottom three images in Figure 2 were produced in exactly the same way as the top three images except that prior to creating the image the elevationvalues for the surface were converted to the log base 10 of the raw elevation values.
Thus, Figure 2 shows the same 3D surface plotted using six different plotting formats. Going from left to right and top to bottom, the six images illustrate:
The significance of the logarithmic conversion can be seen by comparing the two images on the right side of Figure 2 . When the raw elevation values were quantized into 23 levels, quite a few of the elevation values were quantizedinto the minimum value as indicated by the black areas in the top image.
However, after converting the elevation values to logarithmic values, only four points quantized to the minimum value as indicated by the four small blacksquares in the bottom right image. Thus, the top image on the right shows the general area of the lowest elevations on the surface whereas the bottom image onthe right clearly identifies the exact location of each of the four lowest elevations.
Notification Switch
Would you like to follow the 'Digital signal processing - dsp' conversation and receive update notifications?

|
|

|
|

|
|

|
|

|
|

|
|
|
|
|

|
|

|
|

|