

| << Chapter < Page | Chapter >> Page > |
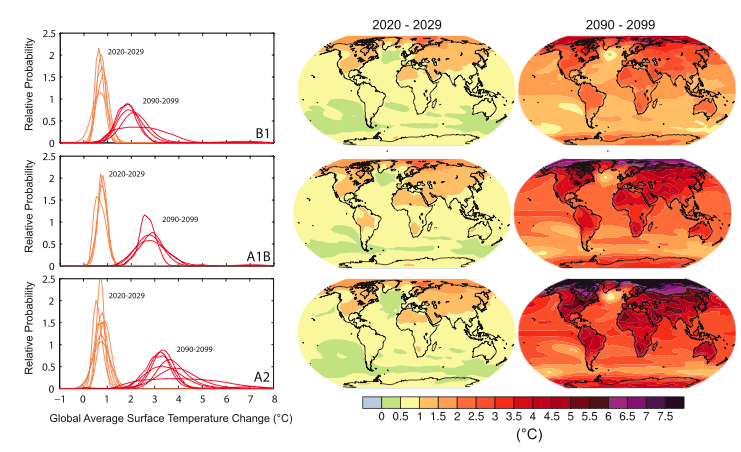
Globally, an increase of between 2°C and 6°C in mean surface temperature is expected by the year 2100. Regionally, these values may differ substantially, and some locations may actually cool over the next century. The hardest hit locations will be the in the high northerly latitudes of the Arctic. Figure Projected Temperature Increases depicts the variation in expected increases in surface air temperature for the time period of 2020-2029 and 2090-2099 with color shading. Notice that in all of these images, the greatest changes are expected to occur at high northerly latitudes. If these projections hold true, ice and snow cover will continue to retreat and enhance the ice-albedo effect discussed in Module Climate Processes; External and Internal Controls . Since the 1980s, NH snow-covered area has shrunk by 3 million square kilometers, and many northerly lakes are spending less time each year covered in ice.
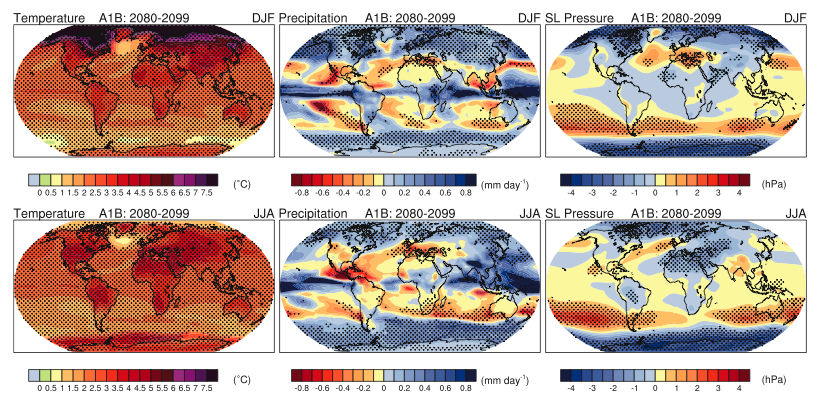
Aside from air temperature, global precipitation patterns and amounts are expected to change. As the atmosphere warms, its ability to hold water vapor increases, which leads to more evaporation from water on the earth’s surface. As this water condenses in the earth’s atmosphere to form clouds and precipitation, the distribution of the precipitation will vary greatly. Current projections forecast an increase in precipitation in the tropics and polar latitudes, with drier conditions over the mid-latitudes. Even though there will be more water vapor in the atmosphere, the distribution of precipitation may be such that large regions formerly unused to drought may be subjected to prolonged dry periods. Focus on the middle panels of Figure Winter and Summer Precipitation Anomalies , which shows the winter (top) and summer (bottom) precipitation anomalies. Notice that the tropics and polar regions are expected to have above normal precipitation, while the mid-latitudes have below normal precipitation. Although more areas are expected to experience prolonged drought, these projections suggest that when it does rain, rainfall will arrive in much greater amounts over shorter time periods. This will lead to increased flash flooding, the deadliest weather phenomenon in the United States.
The goal of climate science is not to craft public policy on global warming. It is to provide the public and policymakers alike with reasonable projections about future climate conditions. This information should be used to show the potential impacts of our presence on the climate system so as to form the best possible mitigation plans. Current projections show that if we are able to slow greenhouse gas emissions, the climate system will respond with the least amount of warming. They also suggest that if we continue with "business as usual" the change in the global climate will be great in magnitude and occur very quickly—both beyond past "natural" change.
How much CO 2 does the average world citizen release each year into the atmosphere? Assume a population of 7 billion people. Compare this number to the United States, China and Qatar.
Explain why the April 2011 tornado outbreak, which set the record for the most tornadoes in a singe 24-hour period, cannot be blamed on climate change.
In Illinois, during the summer of 2009 only two days topped 90°F. In total it was the seventh coolest summer on record. Does this disprove climate change? In what context should we view this cold summer in Illinois?
Why will there still be global warming if there is a complete cessation of CO 2 emissions?
Carbon cap and trade is one of many solutions proposed to reduce CO2 emissions. Make a list of pros and cons to a federally mandated cap and trade system. Be sure to consider what will happen to consumers, businesses and the federal government.
For further reading on global climate change, read A Rough Guide to Climate Change: The Symptoms, The Science, The Solutions , by Robert Henson (Penguin, 2011, ISBN-13: 978-1843537113)
For more information about the:
U.S. Global Change Research Program, visit (External Link)
Global temperatures in the year 2010, visit (External Link)
Notification Switch
Would you like to follow the 'Sustainability: a comprehensive foundation' conversation and receive update notifications?

|
|

|
|

|
|

|
|

|
|

|
|

|
|

|
|

|
|

|