<< Chapter < Page Chapter >> Page >
The Nitrogen Cycle
The Nitrogen Cycle. Figure illustrates the nitrogen cycle on, above, and below the Earth's surface. Source: Physical Geography Fundamentals eBook .

Human interactions with the nitrogen cycle

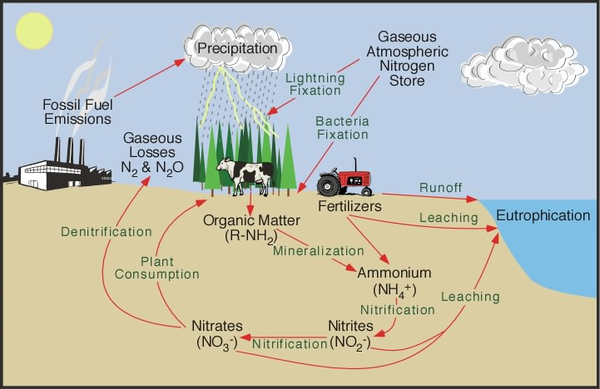
Humans are primarily dependent on the nitrogen cycle as a supporting ecosystem service for crop and forest productivity. Nitrogen fertilizers are added to enhance the growth of many crops and plantations. The enhanced use of fertilizers in agriculture was a key feature of the green revolution that boosted global crop yields in the 1970s. The industrial production of nitrogen-rich fertilizers has increased substantially over time and now matches more than half of the input to the land from biological nitrogen fixation (90 MtN each year). If the nitrogen fixation from leguminous crops (e.g. beans, alfalfa) is included, then the anthropogenic flux of nitrogen from the atmosphere to the land exceeds natural fluxes to the land. As described above, most ecosystems naturally retain and recycle almost all of their nitrogen. The relatively little nitrogen that is being gained or lost by fluxes to the atmosphere and water cycle is also nearly being balanced. When humans make large additions of nitrogen to ecosystems leakage often results, with negative environmental consequences. When the amount of nitrate in the soil exceeds plant uptake, the excess nitrate is either leached in drainage water to streams, rivers, and the ocean or denitrified by bacteria and lost to the atmosphere. One of the main gases produced by denitrifying bacteria (nitrous oxide) is an important greenhouse gas that is contributing to human-induced global warming. Other gases released to the atmosphere by denitrifying bacteria, as well as ammonia released from livestock and sewage sludge, are later deposited from the atmosphere onto ecosystems. The additional nitrogen from this deposition, along with the nitrogen leaching into waterways, causes eutrophication. Eutrophication occurs when plant growth and then decay is accelerated by an unusually high supply of nitrogen, and it has knock-on effects, including the following: certain plant species out-competing other species, leading to biodiversity loss and altered ecosystem function; algal blooms that block light and therefore kill aquatic plants in rivers, lakes, and seas; exhaustion of oxygen supplies in water caused by rapid microbial decomposition at the end of algal blooms, which kills many aquatic organisms. Excess nitrates in water supplies have also been linked to human health problems. Efforts to reduce nitrogen pollution focus on increasing the efficiency of synthetic fertilizer use, altering feeding of animals to reduce nitrogen content in their excreta, and better processing of livestock waste and sewage sludge to reduce ammonia release. At the same time, increasing demand for food production from a growing global population with a greater appetite for meat is driving greater total fertilizer use, so there is no guarantee that better practices will lead to a reduction in the overall amount of nitrogen pollution.

Review questions

There is approximately 2,000 cubic kilometers of water stored in rivers around the world. Using the terms  water cycle flux  and  pool , describe under what conditions removing 1000 cubic kilometers per year from rivers for human use could be sustainable.

Got questions? Get instant answers now!

Each year, around a quarter of the carbon dioxide found in the atmosphere is turned into plant matter via photosynthesis. Does this mean that, in the absence of human activity, all carbon dioxide would be removed from the atmosphere in around four years? Explain your answer.

Got questions? Get instant answers now!

The water, carbon, and nitrogen cycles are all influenced by human activity. Can you describe a human activity that impacts all three cycles? In your example, which of the cycles is most significantly altered?

Got questions? Get instant answers now!

References

Le Quere, C., Raupach, M. R., Canadell, J. G., Marland, G., Bopp, L., Ciais, P., et al. (2009, December). Trends in the sources and sinks of carbon dioxide. Nature Geoscience, 2 , 831-836. doi: 10.1038/ngeo689

Millennium Ecosystem Assessment (2005). Ecosystems and Human Well-Being: Synthesis. Washington DC. Retrieved from (External Link)

Questions & Answers

differentiate between demand and supply giving examples
Lambiv Reply
differentiated between demand and supply using examples
Lambiv
what is labour ?
Lambiv
how will I do?
Venny Reply
how is the graph works?I don't fully understand
Rezat Reply
information
Eliyee
devaluation
Eliyee
t
WARKISA
hi guys good evening to all
Lambiv
multiple choice question
Aster Reply
appreciation
Eliyee
explain perfect market
Lindiwe Reply
In economics, a perfect market refers to a theoretical construct where all participants have perfect information, goods are homogenous, there are no barriers to entry or exit, and prices are determined solely by supply and demand. It's an idealized model used for analysis,
Ezea
What is ceteris paribus?
Shukri Reply
other things being equal
AI-Robot
When MP₁ becomes negative, TP start to decline. Extuples Suppose that the short-run production function of certain cut-flower firm is given by: Q=4KL-0.6K2 - 0.112 • Where is quantity of cut flower produced, I is labour input and K is fixed capital input (K-5). Determine the average product of lab
Kelo
Extuples Suppose that the short-run production function of certain cut-flower firm is given by: Q=4KL-0.6K2 - 0.112 • Where is quantity of cut flower produced, I is labour input and K is fixed capital input (K-5). Determine the average product of labour (APL) and marginal product of labour (MPL)
Kelo
yes,thank you
Shukri
Can I ask you other question?
Shukri
what is monopoly mean?
Habtamu Reply
What is different between quantity demand and demand?
Shukri Reply
Quantity demanded refers to the specific amount of a good or service that consumers are willing and able to purchase at a give price and within a specific time period. Demand, on the other hand, is a broader concept that encompasses the entire relationship between price and quantity demanded
Ezea
ok
Shukri
how do you save a country economic situation when it's falling apart
Lilia Reply
what is the difference between economic growth and development
Fiker Reply
Economic growth as an increase in the production and consumption of goods and services within an economy.but Economic development as a broader concept that encompasses not only economic growth but also social & human well being.
Shukri
production function means
Jabir
What do you think is more important to focus on when considering inequality ?
Abdisa Reply
any question about economics?
Awais Reply
sir...I just want to ask one question... Define the term contract curve? if you are free please help me to find this answer 🙏
Asui
it is a curve that we get after connecting the pareto optimal combinations of two consumers after their mutually beneficial trade offs
Awais
thank you so much 👍 sir
Asui
In economics, the contract curve refers to the set of points in an Edgeworth box diagram where both parties involved in a trade cannot be made better off without making one of them worse off. It represents the Pareto efficient allocations of goods between two individuals or entities, where neither p
Cornelius
In economics, the contract curve refers to the set of points in an Edgeworth box diagram where both parties involved in a trade cannot be made better off without making one of them worse off. It represents the Pareto efficient allocations of goods between two individuals or entities,
Cornelius
Suppose a consumer consuming two commodities X and Y has The following utility function u=X0.4 Y0.6. If the price of the X and Y are 2 and 3 respectively and income Constraint is birr 50. A,Calculate quantities of x and y which maximize utility. B,Calculate value of Lagrange multiplier. C,Calculate quantities of X and Y consumed with a given price. D,alculate optimum level of output .
Feyisa Reply
Answer
Feyisa
c
Jabir
the market for lemon has 10 potential consumers, each having an individual demand curve p=101-10Qi, where p is price in dollar's per cup and Qi is the number of cups demanded per week by the i th consumer.Find the market demand curve using algebra. Draw an individual demand curve and the market dema
Gsbwnw Reply
suppose the production function is given by ( L, K)=L¼K¾.assuming capital is fixed find APL and MPL. consider the following short run production function:Q=6L²-0.4L³ a) find the value of L that maximizes output b)find the value of L that maximizes marginal product
Abdureman
types of unemployment
Yomi Reply
What is the difference between perfect competition and monopolistic competition?
Mohammed
Got questions? Join the online conversation and get instant answers!
Jobilize.com Reply

Get Jobilize Job Search Mobile App in your pocket Now!

Get it on Google Play Download on the App Store Now


Source:  OpenStax, Sustainability: a comprehensive foundation. OpenStax CNX. Nov 11, 2013 Download for free at http://legacy.cnx.org/content/col11325/1.43
Google Play and the Google Play logo are trademarks of Google Inc.

Notification Switch

Would you like to follow the 'Sustainability: a comprehensive foundation' conversation and receive update notifications?

Ask