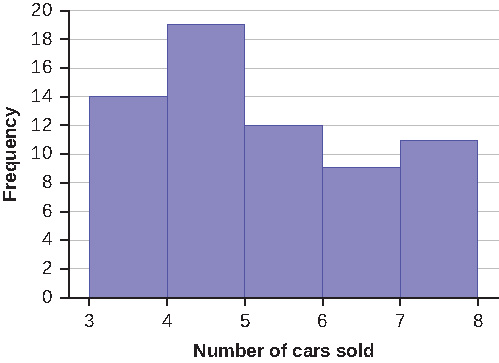
Sixty-five randomly selected car salespersons were asked the number of cars they generally sell in one week. Fourteen people answered that they generally sell three cars; nineteen generally sell four cars; twelve generally sell five cars; nine generally sell six cars; eleven generally sell seven cars. Complete the table.
Data Value (# cars)
Frequency
Relative Frequency
Cumulative Relative Frequency
What does the frequency column in
[link] sum to? Why?
65
What does the relative frequency column in
[link] sum to? Why?
What is the difference between relative frequency and frequency for each data value in
[link] ?
The relative frequency shows the
proportion of data points that have each value. The frequency tells the
number of data points that have each value.
What is the difference between cumulative relative frequency and relative frequency for each data value?
To construct the histogram for the data in
[link] , determine appropriate minimum and maximum
x and
y values and the scaling. Sketch the histogram. Label the horizontal and vertical axes with words. Include numerical scaling.
Answers will vary. One possible histogram is shown:
Construct a frequency polygon for the following:
Pulse Rates for Women
Frequency
60–69
12
70–79
14
80–89
11
90–99
1
100–109
1
110–119
0
120–129
1
Actual Speed in a 30 MPH Zone
Frequency
42–45
25
46–49
14
50–53
7
54–57
3
58–61
1
Tar (mg) in Nonfiltered Cigarettes
Frequency
10–13
1
14–17
0
18–21
15
22–25
7
26–29
2
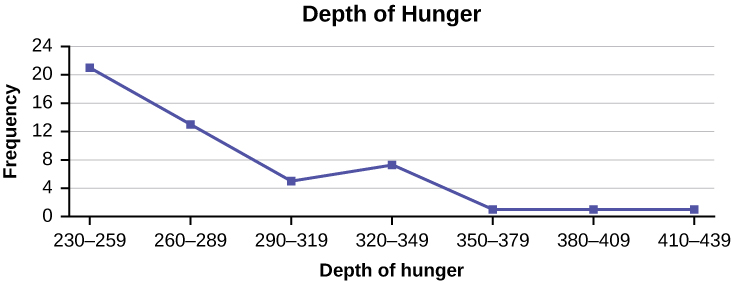
Construct a frequency polygon from the frequency distribution for the 50 highest ranked countries for depth of hunger.
Depth of Hunger
Frequency
230–259
21
260–289
13
290–319
5
320–349
7
350–379
1
380–409
1
410–439
1
Find the midpoint for each class. These will be graphed on the
x -axis. The frequency values will be graphed on the
y -axis values.
Use the two frequency tables to compare the life expectancy of men and women from 20 randomly selected countries. Include an overlayed frequency polygon and discuss the shapes of the distributions, the center, the spread, and any outliers. What can we conclude about the life expectancy of women compared to men?
Life Expectancy at Birth – Women
Frequency
49–55
3
56–62
3
63–69
1
70–76
3
77–83
8
84–90
2
Life Expectancy at Birth – Men
Frequency
49–55
3
56–62
3
63–69
1
70–76
1
77–83
7
84–90
5
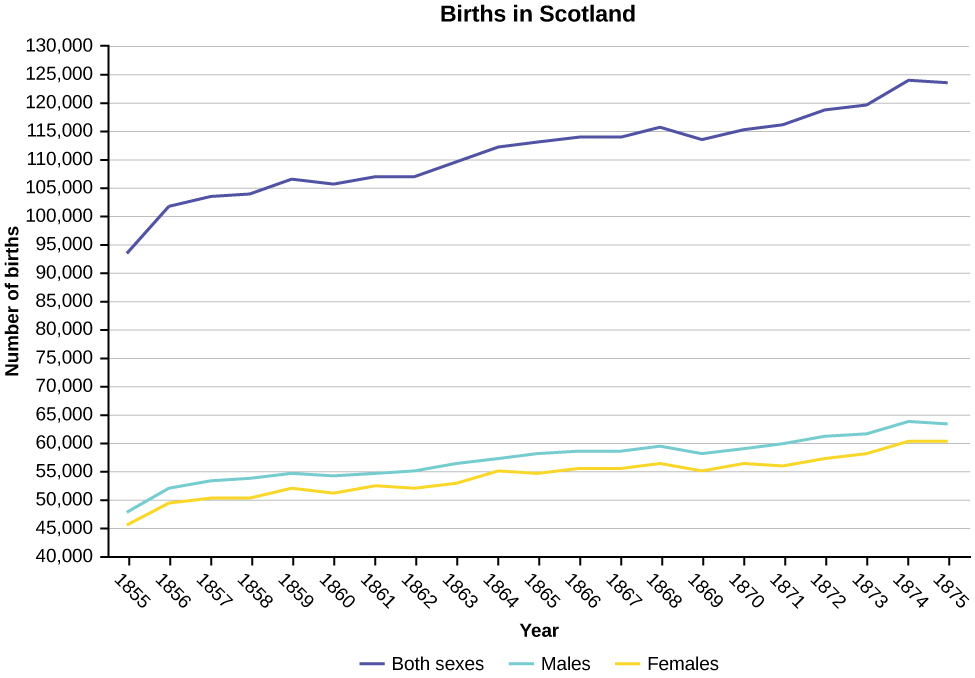
Construct a times series graph for (a) the number of male births, (b) the number of female births, and (c) the total number of births.
Sex/Year
1855
1856
1857
1858
1859
1860
1861
Female
45,545
49,582
50,257
50,324
51,915
51,220
52,403
Male
47,804
52,239
53,158
53,694
54,628
54,409
54,606
Total
93,349
101,821
103,415
104,018
106,543
105,629
107,009
Sex/Year
1862
1863
1864
1865
1866
1867
1868
1869
Female
51,812
53,115
54,959
54,850
55,307
55,527
56,292
55,033
Male
55,257
56,226
57,374
58,220
58,360
58,517
59,222
58,321
Total
107,069
109,341
112,333
113,070
113,667
114,044
115,514
113,354
Sex/Year
1871
1870
1872
1871
1872
1827
1874
1875
Female
56,099
56,431
57,472
56,099
57,472
58,233
60,109
60,146
Male
60,029
58,959
61,293
60,029
61,293
61,467
63,602
63,432
Total
116,128
115,390
118,765
116,128
118,765
119,700
123,711
123,578
The following data sets list full time police per 100,000 citizens along with homicides per 100,000 citizens for the city of Detroit, Michigan during the period from 1961 to 1973.
Year
1961
1962
1963
1964
1965
1966
1967
Police
260.35
269.8
272.04
272.96
272.51
261.34
268.89
Homicides
8.6
8.9
8.52
8.89
13.07
14.57
21.36
Year
1968
1969
1970
1971
1972
1973
Police
295.99
319.87
341.43
356.59
376.69
390.19
Homicides
28.03
31.49
37.39
46.26
47.24
52.33
Construct a double time series graph using a common
x -axis for both sets of data.
Which variable increased the fastest? Explain.
Did Detroit’s increase in police officers have an impact on the murder rate? Explain.
Communication is effective because it allows individuals to share ideas, thoughts, and information with others.
effective communication can lead to improved outcomes in various settings, including personal relationships, business environments, and educational settings. By communicating effectively, individuals can negotiate effectively, solve problems collaboratively, and work towards common goals.
it starts up serve and return practice/assessments.it helps find voice talking therapy also assessments through relaxed conversation.
miss
Every time someone flushes a toilet in the apartment building, the person begins to jumb back automatically after hearing the flush, before the water temperature changes. Identify the types of learning, if it is classical conditioning identify the NS, UCS, CS and CR. If it is operant conditioning, identify the type of consequence positive reinforcement, negative reinforcement or punishment
nature is an hereditary factor while nurture is an environmental factor which constitute an individual personality. so if an individual's parent has a deviant behavior and was also brought up in an deviant environment, observation of the behavior and the inborn trait we make the individual deviant.
Samuel
I am taking this course because I am hoping that I could somehow learn more about my chosen field of interest and due to the fact that being a PsyD really ignites my passion as an individual the more I hope to learn about developing and literally explore the complexity of my critical thinking skills
hello. autism is a umbrella term. autistic kids have different disorder overlapping. for example. a kid may show symptoms of ADHD and also learning disabilities.
before treatment please make sure the kid doesn't have physical disabilities like hearing..vision..speech problem. sometimes these
Jharna
continue..
sometimes due to these physical problems..the diagnosis may be misdiagnosed.
treatment for autism.
well it depends on the severity.
since autistic kids have problems in communicating and adopting to the environment.. it's best to expose the child in situations where the child
Jharna
child interact with other kids under doc supervision.
play therapy.
speech therapy.
Engaging in different activities that activate most parts of the brain.. like drawing..painting. matching color board game.
string and beads game.
the more you interact with the child the more effective
Jharna
results you'll get..
please consult a therapist to know what suits best on your child.
and last as a parent. I know sometimes it's overwhelming to guide a special kid.
but trust the process and be strong and patient as a parent.
Jharna
Got questions? Join the online conversation and get instant answers!
Receive real-time job alerts and never miss the right job again
Source:
OpenStax, Statistics i - math1020 - red river college - version 2015 revision a - draft 2015-10-24. OpenStax CNX. Oct 24, 2015 Download for free at http://legacy.cnx.org/content/col11891/1.8
Google Play and the Google Play logo are trademarks of Google Inc.
Notification Switch
Would you like to follow the 'Statistics i - math1020 - red river college - version 2015 revision a - draft 2015-10-24' conversation and receive update notifications?