<< Chapter < Page Chapter >> Page >
Problems dealing with Fourier Series.

Simple fourier series

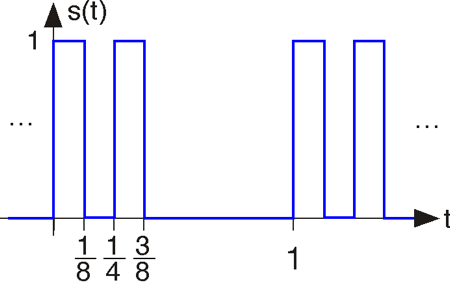
Find the complex Fourier series representations of the following signals without explicitly calculating Fourier integrals. What is the signal's period in each case?

  1. s t t
  2. s t t 2
  3. s t t 2 2 t
  4. s t 2 t t
  5. s t 10 t 6 1 2 t
  6. s t given by the depicted waveform .

Fourier series

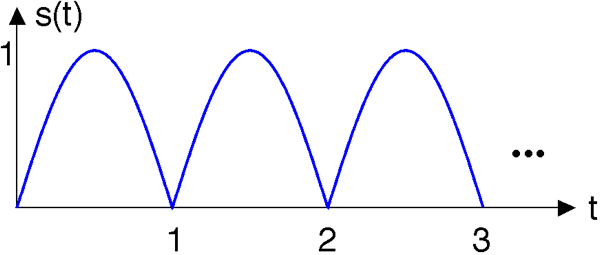
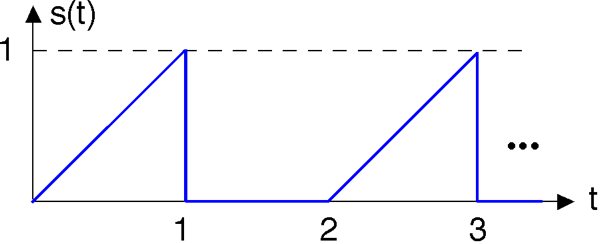
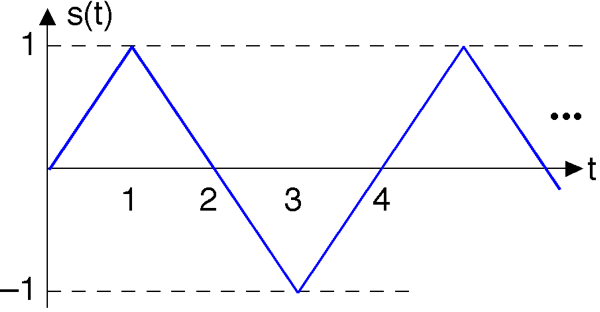
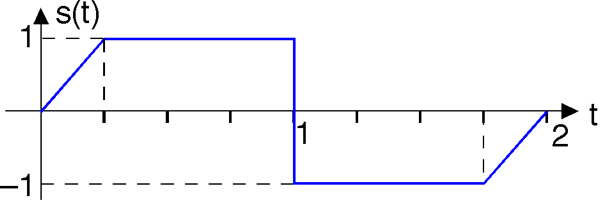
Find the Fourier series representation for the following periodic signals . For the third signal, find the complex Fourier series for the triangle wave without performing the usual Fourier integrals. Hint: How is this signal related toone for which you already have the series?

Phase distortion

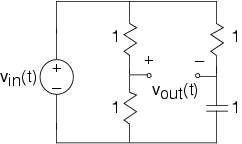
We can learn about phase distortion by returning to circuits and investigate the following circuit .

  1. Find this filter's transfer function.
  2. Find the magnitude and phase of this transfer function. How would you characterize thiscircuit?
  3. Let v in t be a square-wave of period T . What is the Fourier series for the output voltage?
  4. Use Matlab to find the output's waveform for the cases T 0.01 and T 2 . What value of T delineates the two kinds of results you found? The software in fourier2.m might be useful.
  5. Instead of the depicted circuit, the square wave is passed through a system that delays its input, whichapplies a linear phase shift to the signal's spectrum. Let the delay τ be T 4 . Use the transfer function of a delay to compute usingMatlab the Fourier series of the output. Show that the square wave is indeed delayed.

Approximating periodic signals

Often, we want to approximate a reference signal by a somewhat simpler signal. To assess the quality of anapproximation, the most frequently used error measure is the mean-squared error. For a periodic signal s t , ε 2 1 T t 0 T s t s ˜ t 2 where s t is the reference signal and s ˜ t its approximation. One convenient way of findingapproximations for periodic signals is to truncate their Fourier series. s ˜ t k K K c k 2 k T t The point of this problem is to analyze whether thisapproach is the best ( i.e. , always minimizes the mean-squared error).

  1. Find a frequency-domain expression for the approximation error when we use the truncatedFourier series as the approximation.
  2. Instead of truncating the series, let's generalize the nature of the approximation to including any setof 2 K 1 terms: We'll always include the c 0 and the negative indexed term corresponding to c k . What selection of terms minimizes the mean-squarederror? Find an expression for the mean-squared error resulting from your choice.
  3. Find the Fourier series for the depicted signal . Use Matlab to find the truncated approximation and bestapproximation involving two terms. Plot the mean-squared error as a function of K for both approximations.

Long, hot days

The daily temperature is a consequence of several effects, one of them being the sun's heating. If thiswere the dominant effect, then daily temperatures would be proportional to the number of daylight hours. The plot shows that the average daily high temperature does not behave that way.

Questions & Answers

how do you get the 2/50
Abba Reply
number of sport play by 50 student construct discrete data
Aminu Reply
width of the frangebany leaves on how to write a introduction
Theresa Reply
Solve the mean of variance
Veronica Reply
Step 1: Find the mean. To find the mean, add up all the scores, then divide them by the number of scores. ... Step 2: Find each score's deviation from the mean. ... Step 3: Square each deviation from the mean. ... Step 4: Find the sum of squares. ... Step 5: Divide the sum of squares by n – 1 or N.
kenneth
what is error
Yakuba Reply
Is mistake done to something
Vutshila
Hy
anas
hy
What is the life teble
anas
hy
Jibrin
statistics is the analyzing of data
Tajudeen Reply
what is statics?
Zelalem Reply
how do you calculate mean
Gloria Reply
diveving the sum if all values
Shaynaynay
let A1,A2 and A3 events be independent,show that (A1)^c, (A2)^c and (A3)^c are independent?
Fisaye Reply
what is statistics
Akhisani Reply
data collected all over the world
Shaynaynay
construct a less than and more than table
Imad Reply
The sample of 16 students is taken. The average age in the sample was 22 years with astandard deviation of 6 years. Construct a 95% confidence interval for the age of the population.
Aschalew Reply
Bhartdarshan' is an internet-based travel agency wherein customer can see videos of the cities they plant to visit. The number of hits daily is a normally distributed random variable with a mean of 10,000 and a standard deviation of 2,400 a. what is the probability of getting more than 12,000 hits? b. what is the probability of getting fewer than 9,000 hits?
Akshay Reply
Bhartdarshan'is an internet-based travel agency wherein customer can see videos of the cities they plan to visit. The number of hits daily is a normally distributed random variable with a mean of 10,000 and a standard deviation of 2,400. a. What is the probability of getting more than 12,000 hits
Akshay
1
Bright
Sorry i want to learn more about this question
Bright
Someone help
Bright
a= 0.20233 b=0.3384
Sufiyan
a
Shaynaynay
How do I interpret level of significance?
Mohd Reply
It depends on your business problem or in Machine Learning you could use ROC- AUC cruve to decide the threshold value
Shivam
how skewness and kurtosis are used in statistics
Owen Reply
yes what is it
Taneeya
Got questions? Join the online conversation and get instant answers!
Jobilize.com Reply

Get Jobilize Job Search Mobile App in your pocket Now!

Get it on Google Play Download on the App Store Now


Source:  OpenStax, Fundamentals of electrical engineering i. OpenStax CNX. Aug 06, 2008 Download for free at http://legacy.cnx.org/content/col10040/1.9
Google Play and the Google Play logo are trademarks of Google Inc.

Notification Switch

Would you like to follow the 'Fundamentals of electrical engineering i' conversation and receive update notifications?

Ask