Onthou jy nog dat voorwerpe anders lyk as jy hulle van die kant af sien as wanneer jy hulle van bo af sien?
So, byvoorbeeld, is padtekens prentjies van voorwerpe. Ons noem dit SIMBOLE. ‘n Kaart is eintlik ook maar net ‘n prentjie van wat jy ver onder jou sien as jy hoog bo uit die lug afkyk na die grond.
Oor baie jare het die mense wat kaarte teken, simbole vir elke afsonderlike voorwerp ontwerp. Hierdie simbole word deur almal erken en het dus dieselfde betekenis vir almal, anders gaan niemand verstaan wat op ‘n kaart geteken is nie.
Hierdie erkende simbole word dan onderaan kaarte aangedui en word die SLEUTEL van die kaart genoem.
Aktiwiteit 1:
Om die posisie van plekke op 'n kaart aan te dui
[lu 1.4]
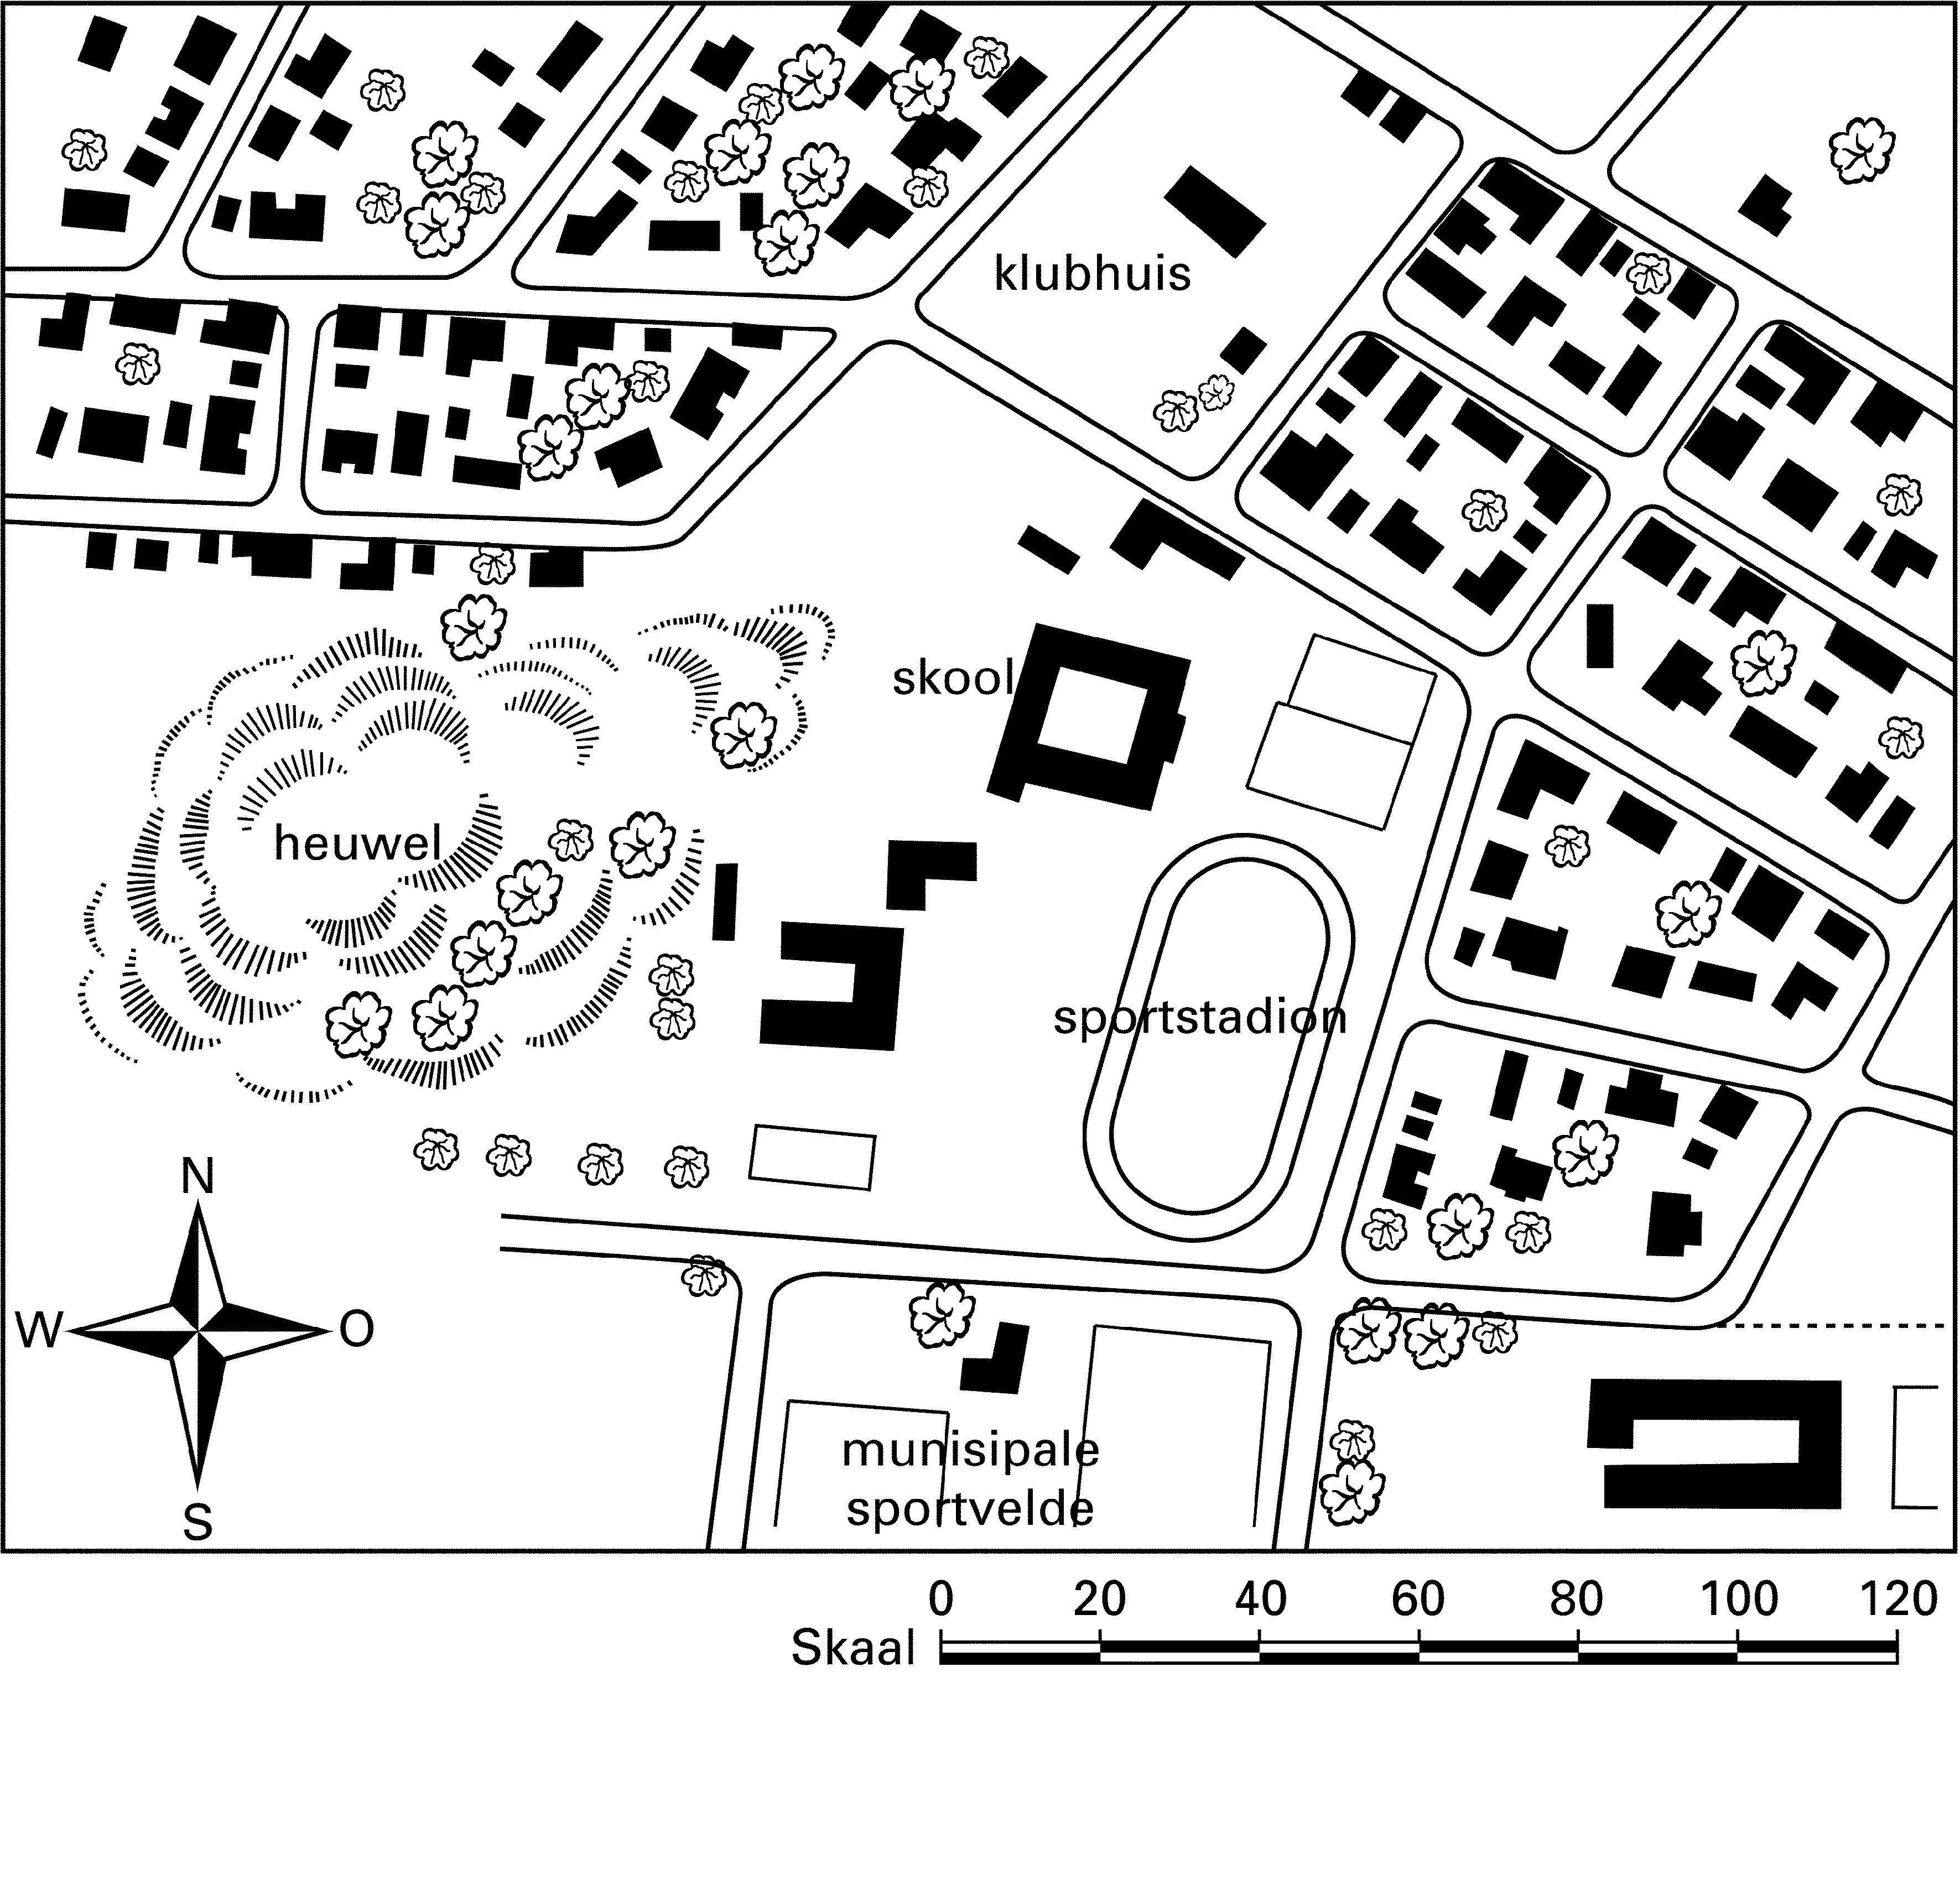
Kom ons kyk na die kaart van die dorpsplan waar Tom woon en probeer dan die vrae wat volg, beantwoord.
TOM SE DORPSPLAN
Sleutel Berg/heuwelBomePaaieGeboueSportvelde
Gestel jy staan by Tom se skool. In watter rigting lê die volgende?
die heuwel
die Munisipale sportvelde
die sportstadion
die klubhuis
Jou onderwyser kan vir jou ‘n kaart van jou eie dorp uitdeel. Voorbeelde van sulke dorpsplanne is gewoonlik by jou dorp se munisipaliteit, toeristeburo of die petrolvulstasies beskikbaar.
Aktiwiteit 2:
Om 'n eenvoudige sketsplan te teken
[lu 1.4]
Gebruik nou die kennis wat jy sover opgedoen het en teken ‘n eenvoudige sketsplan van hoe jy van die skool na jou huis/jou vriend se huis moet ry / loop.
Onthou:
gebruik kaartsimbole met ‘n duidelike sleutel;
dui straatname aan waar bekend;
jou plan moet ‘n duidelike opskrif hê;
dui die roete met rooi aan.
Assessering
LU 1
AARDRYKSKUNDIGE ONDERSOEK
Die leerder is in staat om ondersoekvaardighede te gebruik om aardrykskundige en omgewingsbegrippe en -prosesse te ondersoek.
Dit is duidelik wanneer die leerder:
bronne met nuttige aardrykskundige inligting kan kies en gebruik;
inligting kategoriseer;
sketskaarte en/of planne na aanleiding van veldwaarnemings en afmetings teken;
‘n indeks gebruik om plekke op wêreldatlaskaarte te vind;
deur projekte, bespreking, debat en diagramme, kennis en begrip van die vraagstuk toon [dra die antwoord oor].
Memorandum
Aktiwiteit 1
W/SW
S
SO
N
Questions & Answers
differentiate between demand and supply
giving examples
In economics, a perfect market refers to a theoretical construct where all participants have perfect information, goods are homogenous, there are no barriers to entry or exit, and prices are determined solely by supply and demand. It's an idealized model used for analysis,
When MP₁ becomes negative, TP start to decline.
Extuples Suppose that the short-run production function of certain cut-flower firm is given by: Q=4KL-0.6K2 - 0.112 •
Where is quantity of cut flower produced, I is labour input and K is fixed capital input (K-5). Determine the average product of lab
Kelo
Extuples Suppose that the short-run production function of certain cut-flower firm is given by: Q=4KL-0.6K2 - 0.112 •
Where is quantity of cut flower produced, I is labour input and K is fixed capital input (K-5). Determine the average product of labour (APL) and marginal product of labour (MPL)
Quantity demanded refers to the specific amount of a good or service that consumers are willing and able to purchase at a give price and within a specific time period. Demand, on the other hand, is a broader concept that encompasses the entire relationship between price and quantity demanded
Ezea
ok
Shukri
how do you save a country economic situation when it's falling apart
Economic growth as an increase in the production and consumption of goods and services within an economy.but
Economic development as a broader concept that encompasses not only economic growth but also social & human well being.
Shukri
production function means
Jabir
What do you think is more important to focus on when considering inequality ?
sir...I just want to ask one question... Define the term contract curve? if you are free please help me to find this answer 🙏
Asui
it is a curve that we get after connecting the pareto optimal combinations of two consumers after their mutually beneficial trade offs
Awais
thank you so much 👍 sir
Asui
In economics, the contract curve refers to the set of points in an Edgeworth box diagram where both parties involved in a trade cannot be made better off without making one of them worse off. It represents the Pareto efficient allocations of goods between two individuals or entities, where neither p
Cornelius
In economics, the contract curve refers to the set of points in an Edgeworth box diagram where both parties involved in a trade cannot be made better off without making one of them worse off. It represents the Pareto efficient allocations of goods between two individuals or entities,
Cornelius
Suppose a consumer consuming two commodities X and Y has
The following utility function u=X0.4 Y0.6. If the price of the X and Y are 2 and 3 respectively and income Constraint is birr 50.
A,Calculate quantities of x and y which maximize utility.
B,Calculate value of Lagrange multiplier.
C,Calculate quantities of X and Y consumed with a given price.
D,alculate optimum level of output .
the market for lemon has 10 potential consumers, each having an individual demand curve p=101-10Qi, where p is price in dollar's per cup and Qi is the number of cups demanded per week by the i th consumer.Find the market demand curve using algebra. Draw an individual demand curve and the market dema
suppose the production function is given by ( L, K)=L¼K¾.assuming capital is fixed find APL and MPL. consider the following short run production function:Q=6L²-0.4L³ a) find the value of L that maximizes output b)find the value of L that maximizes marginal product