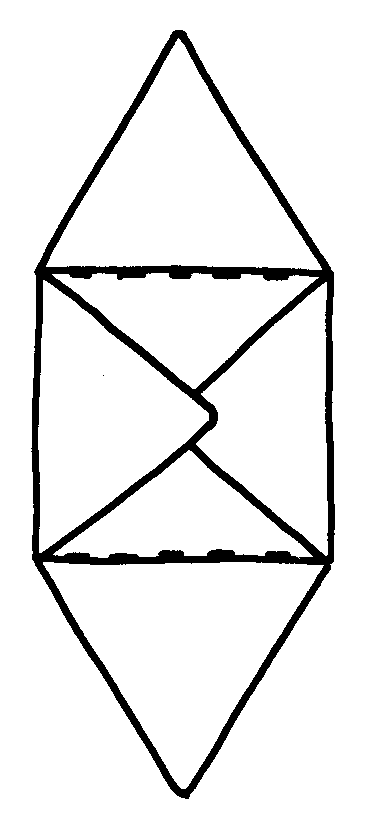
Bring ‘n ou koevert saam skool toe. Maak dit versigtig oop en kyk hoe dit aanmekaar gesit is.
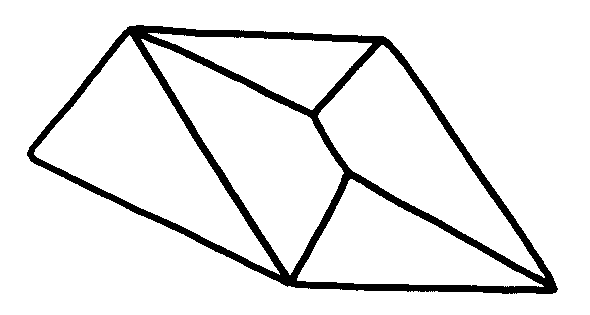
‘n Oopgevoude koevert lyk amper soos ‘n ruit (‘n meetkundige figuur met vier sye wat ewe lank is). Al verskil is dat een van die hoeke afgeknip of afgesny is en vier insnydings is aangebring sodat die koevert mooi kan toevou!
Jy moet al die prosesse (
a – h ) gebruik.
Besluit vooraf hoe jy die verskillende dele van die koevert gaan heg. (Jy kan dit met ‘n skoon A4-blad inoefen.)
Jy mag die mate van die koevert aanpas vanaf meegaande voorbeeld.
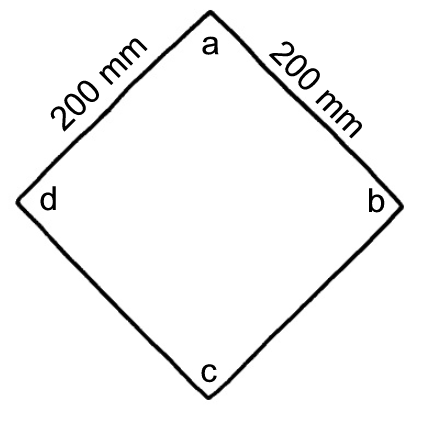
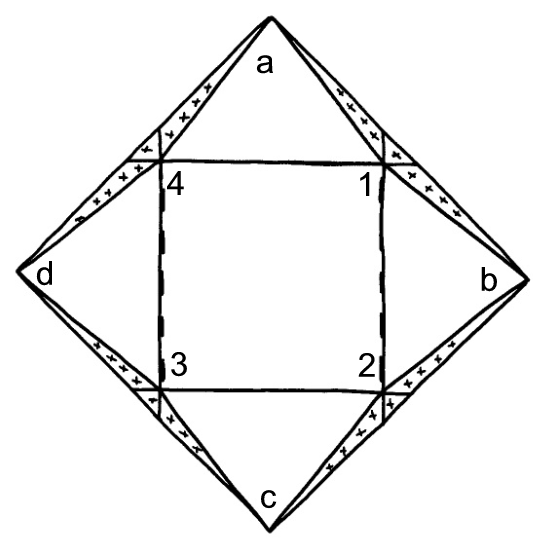
a)
Plaas die
vierkant voor jou soos hierbo aangetoon.
Bring die letters
a, b, c, d aan op die hoeke.
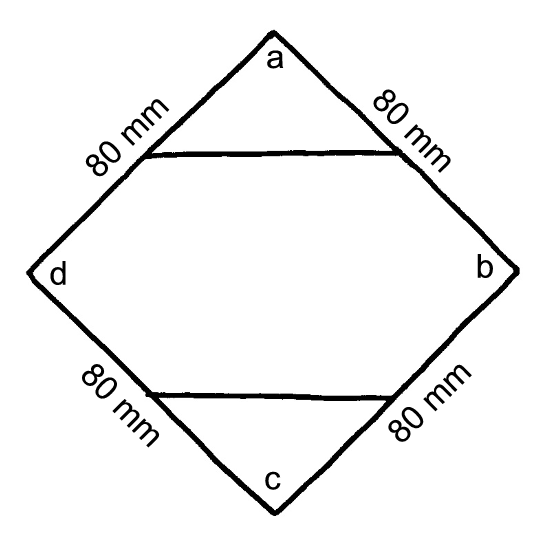
b)
Meet die afstande soos aangedui en trek die twee
ligte, horisontale lyne.
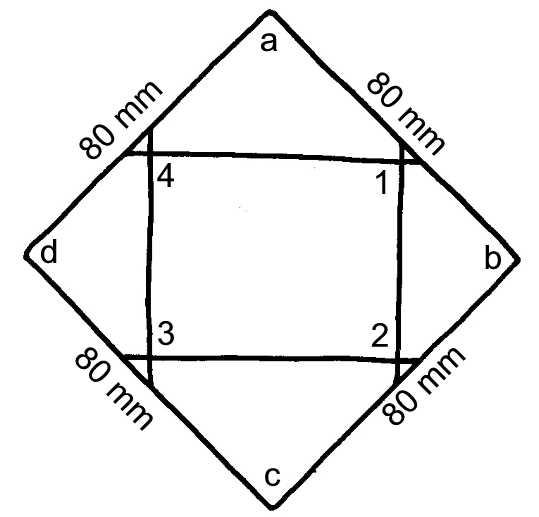
c)
Meet die afstande soos aangedui en trek liggies die twee
vertikale lyne.
Nommer die hoeke 1, 2, 3, 4.
d)
Trek harde lyne by
a ,1; 1,
b ;
b ,2; 2,
c ;
c ,3, ens.
Trek
kruisies om die
afval aan te dui.
Trek strepies op lyne 1,2; 2,3, ens. Om die
voulyne aan te dui, gebruik ‘n skerp potlood.
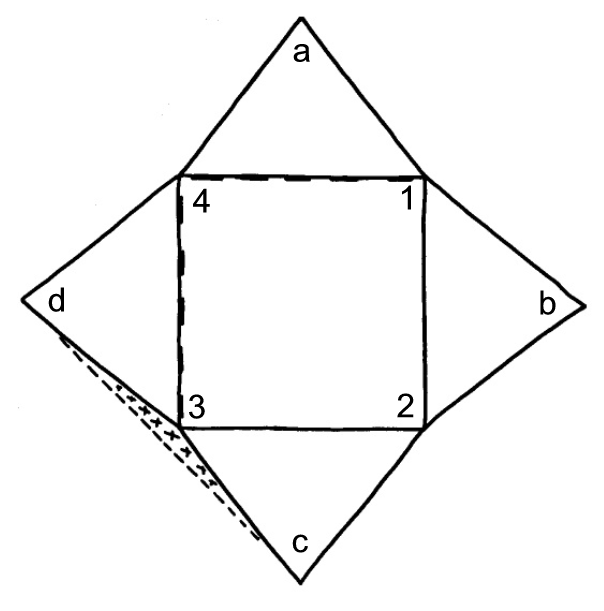
e)
Kontrolepunt
Kom wys vir my.
Knip met ‘n
veiligheidskêrtjie op lyne
a 1,
b 1,
b 2,
c 2, ens.
Gooi die afvalstukkies in die vullisblik.
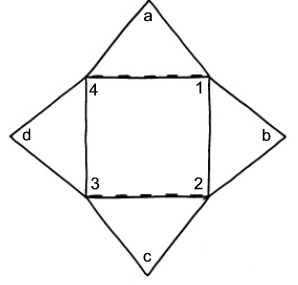
f)
Gebruik ‘n
veiligheidsliniaal en ‘n
skerp voubeen om die voulyne te stryk.
Druk die liniaal styf vas.Staan wanneer jy die voubeen gebruik.
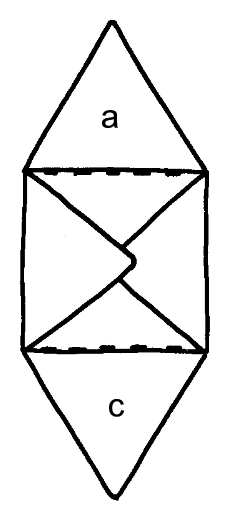
g)
Vou eers punt
b na die binnekant, dan punt a en laastens punt
c .Gaan vra jou onderwyser om jou te wys watter puntjies afgesny moet word.
h)
Trek 'n ligte lyntjie om aan te dui waar, en tot waar, jy gom moet smeer.
Te veel gom sal onnet wees, omdat dit uitpeul.Vryf alle hoekies en rande plat.
Assessering
Leeruitkoms 1: tegnologiese prosesse en vaardighede
Die leerder is in staat om tegnologiese prosesse en vaardighede eties en verantwoordelik toe te pas deur toepaslike inligtings- en kommunikasietegnologie te gebruik.
Assesseringstandaard
Dis duidelik wanneer die leerder:
1.1 uitvind, met hulp, oor die agtergrondkonteks (bv. mense, omgewing) wanneer ‘n probleem, behoefte of geleentheid gegee word;
1.7 ’n kort beskrywing gee van ‘n plan om iets te maak en die hoofstappe noem;
gepaste gereedskap en materiaal gebruik om produkte te maak deur eenvoudige vorms in ‘n verskeidenheid soorte materiaal af te meet, uit te merk en te sny, en dit deur middel van verskeie tegnieke aan mekaar te heg of te las;
netjies en veilig werk.
Questions & Answers
differentiate between demand and supply
giving examples
In economics, a perfect market refers to a theoretical construct where all participants have perfect information, goods are homogenous, there are no barriers to entry or exit, and prices are determined solely by supply and demand. It's an idealized model used for analysis,
When MP₁ becomes negative, TP start to decline.
Extuples Suppose that the short-run production function of certain cut-flower firm is given by: Q=4KL-0.6K2 - 0.112 •
Where is quantity of cut flower produced, I is labour input and K is fixed capital input (K-5). Determine the average product of lab
Kelo
Extuples Suppose that the short-run production function of certain cut-flower firm is given by: Q=4KL-0.6K2 - 0.112 •
Where is quantity of cut flower produced, I is labour input and K is fixed capital input (K-5). Determine the average product of labour (APL) and marginal product of labour (MPL)
Quantity demanded refers to the specific amount of a good or service that consumers are willing and able to purchase at a give price and within a specific time period. Demand, on the other hand, is a broader concept that encompasses the entire relationship between price and quantity demanded
Ezea
ok
Shukri
how do you save a country economic situation when it's falling apart
Economic growth as an increase in the production and consumption of goods and services within an economy.but
Economic development as a broader concept that encompasses not only economic growth but also social & human well being.
Shukri
production function means
Jabir
What do you think is more important to focus on when considering inequality ?
sir...I just want to ask one question... Define the term contract curve? if you are free please help me to find this answer 🙏
Asui
it is a curve that we get after connecting the pareto optimal combinations of two consumers after their mutually beneficial trade offs
Awais
thank you so much 👍 sir
Asui
In economics, the contract curve refers to the set of points in an Edgeworth box diagram where both parties involved in a trade cannot be made better off without making one of them worse off. It represents the Pareto efficient allocations of goods between two individuals or entities, where neither p
Cornelius
In economics, the contract curve refers to the set of points in an Edgeworth box diagram where both parties involved in a trade cannot be made better off without making one of them worse off. It represents the Pareto efficient allocations of goods between two individuals or entities,
Cornelius
Suppose a consumer consuming two commodities X and Y has
The following utility function u=X0.4 Y0.6. If the price of the X and Y are 2 and 3 respectively and income Constraint is birr 50.
A,Calculate quantities of x and y which maximize utility.
B,Calculate value of Lagrange multiplier.
C,Calculate quantities of X and Y consumed with a given price.
D,alculate optimum level of output .
the market for lemon has 10 potential consumers, each having an individual demand curve p=101-10Qi, where p is price in dollar's per cup and Qi is the number of cups demanded per week by the i th consumer.Find the market demand curve using algebra. Draw an individual demand curve and the market dema
suppose the production function is given by ( L, K)=L¼K¾.assuming capital is fixed find APL and MPL. consider the following short run production function:Q=6L²-0.4L³ a) find the value of L that maximizes output b)find the value of L that maximizes marginal product